App Inventor Chart Components: Project Summary
Last post, I have wrapped up the implemented methods for importing data to the Charts for the App Inventor Charts project that I have been working on. This post will cover one of the last two Chart types which were implemented in this project – The Pie Chart. This post follows up directly from the Chart type selection implementation post.
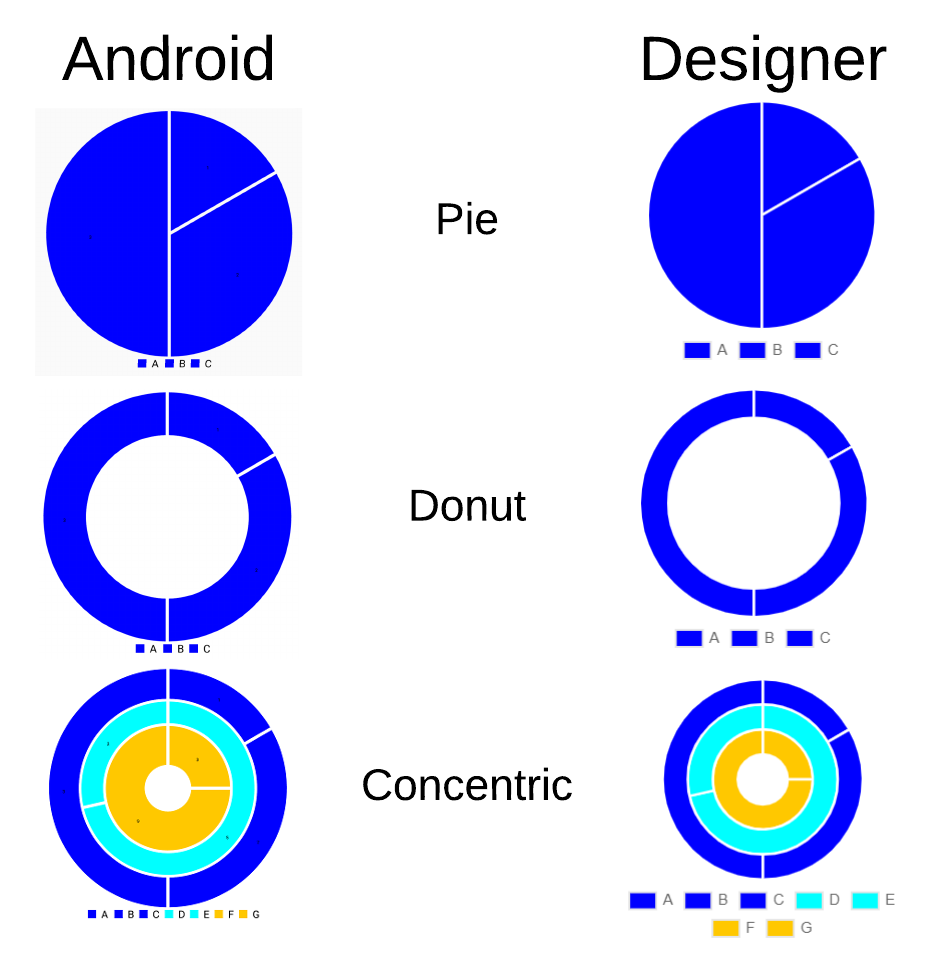
The Pie Chart, as implemented in this post, looks like this when compared side-by-side in both the Designer and the Android implementations:
With regards to the data of the Chart, it is quite important to note that the Pie Chart is quite a special case compared to other available Charts (e.g. Line, Area, Scatter and Bar). The key difference is that the Pie Chart does not have any axes, meaning that an x value attains a different interpretation.
While a choice could have been made to entirely remove the x value for the Pie Chart, and have the Pie Chart take in a Data component which only has a single value, it was instead decided to interpret the x value as the value’s label, which is then displayed on the Legend.
For example, consider the following Chart:
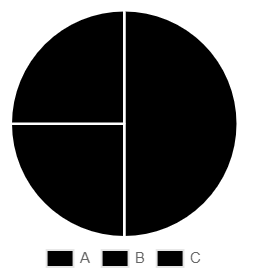
We have three values on the Pie Chart. The ‘A’ value corresponds to 50, the ‘B’ and ‘C’ values correspond to 25. Here, the ‘A’ value is the x value, and the number 50 is the y value.
In tuple form, the entry is then represented as follows:
(A, 50)Now a question might arise – if the x value now uses a text representation, then should the Chart type also not use a different Chart Data type?
The way this issue was tackled is by having the blocks take input as text rather than numbers. With the introduced tuple concepts, we treat each element in the tuple as a String, each of which is later interpreted by the Chart Data Model itself.
In this case, by allowing text parameters rather than number parameters, we essentially add support for more Chart Data types while also providing some transparency to the user.
Recall how we would import data to a Line Chart Data model via the AddEntry block:
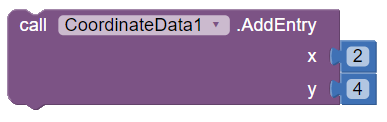
This same block can be used for Pie Chart Data components as well, but would use the x value number as text.
We can specify text input as well to the block, as follows:
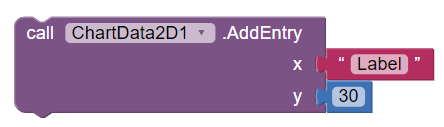
With this implementation in mind, we can essentially reuse the same Chart Data component for all 2-dimensional Chart types.
The Pie Chart is also a rather special case due to the special treatment of the legend. Unlike other Chart types, where the legend entries simply correspond to an individual data series, the Pie Chart’s legend typically represents each slice in the Pie Chart. Due to this different representation, manual handling of the Legend is required.
Let us now take a look at the concrete implementation regarding the data of the Pie Chart.
The core method of the Data Series is the getEntryFromTuple method, which is implemented as follows:
  @Override
  public Entry getEntryFromTuple(YailList tuple) {
    try {
      // Tuple is expected to have at least 2 entries.
      // The first entry is assumed to be the x value, and
      // the second is assumed to be the y value.
      String xValue = tuple.getString(0);
      String yValue = tuple.getString(1);

      try {
        // Attempt to parse the y value String representation
        float y = Float.parseFloat(yValue);

        // The y value is the first argument,
        // the x value is the second (label)
        return new PieEntry(y, xValue);
      } catch (NumberFormatException e) {
        // Nothing happens: Do not add entry on NumberFormatException
      }
    } catch (Exception e) {
      // 2-tuples are invalid when null entries are present, or if
      // the number of entries is not sufficient to form a pair.
    }

    return null;
  }
In previous cases (Line, Area, Scatter Charts), we have parsed both the x and the y values. However, we do not parse the xValue here to a number, since we outlined the x value to be a text value. Otherwise we parse the y value to a number, since the y value is expected to be a numeric value.
Then, we have the addEntryFromTuple method, which is implemented as follows:
  /* Since a custom legend is used which is shared by all the separate
   * Pie Chart views (rings), for ease of deletion and operations on
   * the entries, the Legend Entries List is kept for this single
   * Data Series. The central view reference is kept to modify the
   * Legend accordingly.
   */
  private List<LegendEntry> legendEntries = new ArrayList<LegendEntry>();
  private PieChartView view;

  public void addEntryFromTuple(YailList tuple) {
    // Construct a PieEntry from the specified tuple and add it to
    // the Data Series.
    PieEntry entry = (PieEntry) getEntryFromTuple(tuple);

    if (entry != null) {

      this.entries.add(entry);

      // Construct a new Legend Entry
      LegendEntry legendEntry = new LegendEntry();

      // The label of the Legend Entry should be the x value of the tuple
      legendEntry.label = tuple.getString(0);

      // Get the entry count of the Data series and the
      // colors of the Data Series
      int entriesCount = this.entries.size();
      List<Integer> colors = getDataset().getColors();

      // The index of the color value to use is the
      // last entry (the one which has just been added)
      // modulo the size of the colors List (since
      // there could be less colors than entries)
      int index = (entriesCount - 1) % colors.size();

      // Set the color of the Legend Entry
      legendEntry.formColor = colors.get(index);

      // Add the Legend Entry both to the local Legend Entries List and
      // to the Legend of the view itself.
      legendEntries.add(legendEntry);
      view.addLegendEntry(legendEntry);
    }
  }
The method, with regards to data adding, is simple – the entry is simply added to the Data Series. However, since we are handling the Legend Entries manually to represent each entry, we have to construct a Legend Entry, and add it to the Legend.
Since we may have multiple Data Series, and they should all share the same Legend, a local reference of the PieChartView which created the Model is kept. In addition, a local List of the Legend Entries is kept to make removal and addition of entries easier.
With regards to the Legend Entry, the following is done to construct it:
With regards to setting the color of the Legend Entry, the principle here is that there might be more data entries than the colors. As such, the colors are alternated between entries in order. To retrieve the color, a modulo operation is then applied using the size of the colors list so that the index is always in range.
Finally, we have the method to remove the entry, which looks as follows:
  public void removeEntry(int index) {
    // Entry exists; remove it
    if (index >= 0) {
      entries.remove(index);

      // Remove the corresponding Legend entry (same index as Data Set index)
      LegendEntry removedEntry = legendEntries.remove(index);
      view.removeLegendEntry(removedEntry);

      // Update the colors of the Legend entries
      updateLegendColors();
    }
  }
Here, the removal of the entry itself is simple – the entry with the specified index is simply removed from the entries. With regards to the Legend, the corresponding Legend Entry is removed both from the local List, and from the view. Finally, the Legend Colors have to be updated primarily to fix up the colors, since the alternation of the colors should now be different.
One interesting observation here is that we use the same index to remove the entry, and the Legend Entry. Note how in the addEntryFromTuple method we add an entry and a Legend Entry at the same time. This ensures that they both use the same index in the List, therefore we have ease of access when accessing either the data, or the Legend entry – both correspond to the same index.
The view of the Pie Chart is a very tricky case for the chosen Android library. The ideas that we will use will heavily rely on a post I made earlier that described the implementation of concentric Pie Charts in the MPAndroidChart library. For context, since the MPAndroidChart library does not support Pie Charts with multiple Data Series, we have to come up with manual ways to support this.
The idea that I came up with and implemented with regards to concentric Pie Charts is to make use of multiple Pie Charts, one on top of another, in varying size. This makes it seem as if the Pie Charts are part of one big Pie Chart, where each individual Pie Chart is a ring of the bigger Pie Chart. Alongside this, we also define the root Pie Chart which is the outermost Pie Chart ring, which is also responsible for holding the Legend, since the root Pie Chart is the biggest ring (height and width wise) in the Pie Chart.
In order to realize this idea in practice, we make use of a central Root View (not to be confused with the root Pie Chart) which holds the Pie Charts together. The root view is a RelativeLayout in which the Pie Charts will be centered in and sized in such a way that each smaller Pie Charts appears in the center of the bigger Pie Charts
The code to retrieve the View and construct the Pie Chart View is as follows:
  private RelativeLayout rootView; // Root view to store all the Pie Chart views
  private List<PieChart> pieCharts = new ArrayList<PieChart>(); // List to store all the Pie Chart views

  /**
   * Creates a new Pie Chart view instance which manages
   * all the Pie Chart rings.
   * @param context  Activity context where the view should be initialized in
   */
  public PieChartView(Activity context) {
    // Instantiate the Root View layout and the Root Chart
    rootView = new RelativeLayout(context);
    chart = new PieChart(context); // the Chart instance represents the root Pie Chart

    // ...
  }

  @Override
  public View getView() {
    // Returns the underlying root RelativeLayout view
    // which stores all the Pie Chart rings
    return rootView;
  }
Note the pieCharts List variable, which is meant to store all the Pie Chart views in order. The first view will correspond to the root Chart, the second to the inner Chart closest to the root Chart, the third one being the inner Chart closest to the second Chart, and so on.
A Pie Chart is added to the Pie Charts List whenever a Chart Data Model is created. We treat the createChartDataModel as an event when a new Data Series is added to the View. Since we need a single Pie Chart for every Pie Chart ring, we create a new Pie Chart upon creating a Data Series.
  @Override
  public ChartDataModel createChartModel() {
    // Create and add an inner Pie Chart ring
    PieChart pieChart = createPieChartRing();

    // Return a new Pie Chart Data model linking it to
    // the created Pie Chart ring
    return new PieChartDataModel(this, pieChart, new PieData());
  }
In the snippet, note how the PieChartDataModel has 3 arguments. The actual pieChart is actually passed in to the PieChartDataModel due to it being linked to the Data Series. The PieChartDataModel is constructed as follows:
  /**
   * Initializes a new PieChartDataModel object instance.
   *
   * Links the Data Model to the specified Chart, since one
   * Pie Chart instance represents a single ring of a Pie Chart.
   *
   * @param chart  Chart to link Data Model
   * @param data Chart data instance
   */
  public PieChartDataModel(PieChartView view, PieChart chart, PieData data) {
    super(data);

    // Initialize dataset and add it to the Data object
    dataset = new PieDataSet(new ArrayList<PieEntry>(), "");
    this.data.addDataSet(dataset);

    // Set the data to the Pie Chart (one Pie Chart component
    // can have at most one Dataset in v3.1.0)
    chart.setData(data);

    setDefaultStylingProperties();
    this.view = view;
  }
It is also important to note that not only do we create a new Pie Chart for the Data Series, but we also create a new PieData object to use for the Pie Chart. Hence, we are actually using individual, separated Pie Charts to create a concentric Pie Chart.
Let us take a look at the method to create a Pie Chart ring:
  /**
   * Creates, initializes & attaches a new Pie Chart ring to add to the
   * Pie Chart root view.
   *
   * To be called upon creating a new PieChartDataModel.
   * @return  created Pie Chart instance
   */
  private PieChart createPieChartRing() {
    PieChart pieChart;

    if (pieCharts.isEmpty()) { // No Pie Charts have been added yet (root Pie Chart)
      pieChart = chart; // Set Pie Chart to root Pie Chart
    } else { // Inner Pie Chart
      pieChart = new PieChart(activity); // Create a new Pie Chart
      pieChart.getDescription().setEnabled(false); // Hide description
      pieChart.getLegend().setEnabled(false); // Hide legend
    };

    // Set the corresponding properties of the Pie Chart view
    // to the newly created Pie Chart
    setPieChartProperties(pieChart);

    // Create RelativeLayout params with MATCH_PARENT height and width and
    // CENTER_IN_PARENT property set to true. A future method call will
    // adjust all the necessary widths & heights.
    RelativeLayout.LayoutParams params = new RelativeLayout.LayoutParams
        (ViewGroup.LayoutParams.MATCH_PARENT,
        ViewGroup.LayoutParams.MATCH_PARENT);
    params.addRule(RelativeLayout.CENTER_IN_PARENT, RelativeLayout.TRUE);
    pieChart.setLayoutParams(params);

    pieCharts.add(pieChart); // Add new Pie Chart (ring) to the Pie Charts List
    rootView.addView(pieChart); // Add new Pie Chart (ring) to the root View

    // Return the newly constructed Pie Chart
    return pieChart;
  }
The first step of the method is determining whether the root Pie Chart has been added to the Pie Charts list (meaning that the Chart View has at least 1 Data Series). If this is not the case, a completely new Pie Chart is created with the legend and the description disabled (these properties should only be visible in the root Pie Chart itself due to the way we interpret these Pie Charts)
Next, the properties are set to the Pie Chart to return as the ring. The most important one is the setting of the RelativeLayout parameters, which ensure that the height and width match the root view, and the newly created Pie Chart is centered in the root view.
Finally, the created Pie Chart is added to both the Pie Charts List, and to the root view Layout.
The implementation that we have discussed so far takes care of creating the actual Pie Charts, but does not take care of scaling them accordingly. Pie Chart scaling is quite a heavy operation, and should only be done once. As such, a decision was made to only re-scale the Pie Chart rings upon setting the Pie Chart Radius property, which is expected to be called only after all the components are initialized. The code snippet shows where the method call is placed for resizing the rings:
  /**
   * Sets the radius of the Pie Chart (in percentage)
   *
   * E.g. 100% - full Pie Chart, 50% - donut
   *
   * @param percent  percentage of the radius to fill.
   */
  public void setPieRadius(int percent) {
    // Disallow setting percentage that does not fall
    // in the range [0, 100]
    if (percent > 100) {
      percent = 100;
    } else if (percent < 0) {
      percent = 0;
    }

    // Calculate the radius of the hole of the Pie Charts
    this.pieHoleRadius = 100 - percent;

    // Resize Pie Chart rings accordingly
    resizePieRings();
  }
In the Chart component class, we implement the onInitializeListener interface to listen for events when the application is initialized, and we only set the radius after the initialization is complete to ensure that all Data Series are added to the Pie Chart:
    @Override
    public void onInitialize() {
        // If the Chart View is of type PieChartView, the
        // radius of the Chart has to be set after initialization
        // due to the method relying on retrieving width and height
        // via getWidth() and getHeight(), which only return non-zero
        // values after the Screen is initialized.
        if (chartView instanceof PieChartView) {
            ((PieChartView)chartView).setPieRadius(pieRadius);
            chartView.Refresh();
        }
    }
The method to resize the Pie Chart rings is shown below:
  /**
   * Resizes, rescales and sets the radius of all the inner
   * Pie Charts according to the total count of Pie Charts
   * to create a representative concentric ring Pie Chart.
   */
  public void resizePieRings() {
    // Store width and height of last Pie Chart (since getHeight() and
    // getWidth() will not return the needed result instantly)
    int lastWidth = 0;
    int lastHeight = 0;

    // Calculate the reduction factor to apply to both the radius and the scaling.
    // The primary reduction factor here is the count of Pie Chart rings. The
    // more rings, the smaller the factor (so the main factor itself is 1/#rings)
    // The constant 0.75f was carefully picked through trial and error. It could
    // be changed to something else, which would result in the inner-most rings
    // becoming smaller. A factor of pieHoleRadius/100f is added for the reason
    // that Pie Charts with a very small pie hole radius require a lesser reduction
    // factor to maintain a larger fill percentage.
    float reductionFactor = (0.75f + pieHoleRadius/100f) / pieCharts.size();

    // Calculate the current fill radius of the Chart (100% is the maximum,
    // so we subtract the pie hole radius from the 100% to get the part
    // that is filled)
    float radius = (100f - pieHoleRadius);

    // Calculate the new hole radius. The radius is first multiplied
    // by the reduction factor (we reduce the fill radius), and then
    // the hole radius is calculated by subtracting the reduced radius
    // from 100%.
    float newHoleRadius = 100f - radius * reductionFactor;

    for (int i = 0; i < pieCharts.size(); ++i) {
      PieChart pieChart = pieCharts.get(i);

      // Change the radius of the Pie Chart according
      // to the newly calculated hole radius
      boolean lastChart = (i == pieCharts.size() - 1);
      changePieChartRadius(pieChart, newHoleRadius, lastChart);

      // FP on i != 0 always false
      if (i != 0) { // Inner Chart
        // Calculate the scaling factor to use for the width and
        // height of the Chart. The hole radius essentially represents
        // how much free space is available inside the Chart. The value
        // is then divided by 100 to get a fraction to use as the new size.
        float scalingFactor = (newHoleRadius)/100f;

        // Compute new width & height using the scaling factor
        lastWidth = (int)(lastWidth * scalingFactor);
        lastHeight = (int)(lastHeight * scalingFactor);

        // Change the size of the current Pie Chart
        changePieChartSize(pieChart, lastWidth, lastHeight);
      } else { // Root Chart
        // Set last height & width to use for the subsequent Charts.
        lastHeight = pieChart.getHeight();
        lastWidth = pieChart.getWidth();
      }

      // Invalidate the resized Pie Chart
      pieChart.invalidate();
    }
  }
The code itself holds the most complex part of the Pie Chart View implementation, since all of the scaling has to be done manually to fit the Pie Chart rings.
In the method, firstly, the reduction factor is calculated in the following way: \(f = (0.75 + h/100)/n\)
Here, h represents the current Pie Hole Radius (meaning the percentage of the Pie Chart that is a hole), and n represents the number of Pie Charts present in the view (or the number of Data Series, in other words).
The reduction factor is essentially the value that will be used to reduce the current radius of the Pie Charts. The reason why a reduction of the radius is needed is because the outer Pie Charts need to have larger holes to fit inner Pie Charts, and as such, the radius must be reduced. Additionally, the Pie Charts itself are scaled down in order to have the more outer Pie Charts bigger than the inner ones.
In essence, the lower the reduction factor, the higher the new hole will be for the outer Pie Charts.
The reason why the formula was chosen based on the following observations:
Next, we calculate the actual radius of the Pie Chart, which is done as follows (r represents the radius, and h represents the hole radius): $$ r = 100 - h $$
The reason why we use the radius for future calculations is because it makes it easier instead of using the hole radius. Since we want to scale the radius itself rather than the hole radius of the Pie Charts, it makes it easier to come up with a reduction factor for the radius, rather than coming up with a scaling factor for the hole radius.
Having the radius calculated, we re-calculate the new hole radius as follows: $$ h = 100 - r * f $$
Having calculated the new hole radius, we iterate through all the Pie Charts, and apply the new Pie Chart radius. We will see later that we apply a completely different scaling to the innermost Pie Chart.
The final step of the loop is scaling the Pie Chart itself, by also using a reducing scaling factor, which is calculated as follows: $$ s = h/100 $$
The reasoning behind this calculation is the fact that the hole radius represents how much space is free in the Pie Chart’s center. For instance, if we have a Pie Chart with a hole radius of 90%, 90% of the Pie Chart is hollow. Since Pie Charts are circular, we can directly apply the scaling to their heights and widths.
One important thing to note is that the last width and height are constantly saved. We essentially keep scaling the Pie Charts down with each coming Chart. We also keep our outermost Pie Chart’s height and width constant as a base case.
Thus, the newly calculated height and width is always a fraction of the last Chart’s height and width. This can be formalized by the following equation (here h is the height, i represents the index of the Pie Chart in the view, and s is the scaling factor): \(h = \begin{cases} h_0, & \text{if } i = 0, \\ s*h_{i-1}, & \text{else}. \end{cases}\)
The way that the Pie Chart radius is changed can be seen in the snippet below:
  /**
   * Helper method to change the radius of the specified Pie Chart
   * to the specified new radius. The new radius also depends on
   * whether this is the last (inner-most) Chart or not.
   * @param pieChart  Pie Chart to change radius of
   * @param newHoleRadius  New radius to set to the Pie Chart
   * @param lastChart  Boolean to indicate whether the specified Chart is the last one
   */
  private void changePieChartRadius(PieChart pieChart, float newHoleRadius, boolean lastChart) {
    if (!lastChart) { // Outer rings
      // Set the radius to the specified new hole radius
      pieChart.setTransparentCircleRadius(newHoleRadius);
      pieChart.setHoleRadius(newHoleRadius);

      // Draw the hole in the Pie Chart to free space
      // for subsequent inner Pie Charts
      pieChart.setDrawHoleEnabled(true);
    } else { // Inner-most ring
      // Pie hole radius is 0; Disable drawing the hole in the Pie Chart
      if (pieHoleRadius == 0) {
        pieChart.setDrawHoleEnabled(false);
      } else {
        // Calculate the difference between the new pie hole radius and the
        // current pie hole radius. OBSERVATION: for r [0, 100], this difference
        // will always be positive.
        float delta = newHoleRadius - pieHoleRadius;

        // Use 1f + delta% as a factor for the current pieHoleRadius.
        // Through trial and error, this value worked better than
        // using the pieHoleRadius or the newRadius directly on
        // the inner Chart. Using the pieHoleRadius produces
        // an inner-most Chart that is far too large than the outer
        // rings, while using the newHoleRadius produces a radius that
        // is too small for certain cases (holeRadius < 25%). Hence,
        // some percentage is used here instead. (the higher the
        // difference between the new and old radius, the bigger
        // the new radius)
        float setRadius = pieHoleRadius * (1f + (delta) / 100f);


        // Set the hole radius of the Pie chart to the calculated radius
        pieChart.setTransparentCircleRadius(setRadius);
        pieChart.setHoleRadius(setRadius);
      }
    }
  }
Firstly, the method checks whether the Pie Chart argument specified is the last Chart in the List (the innermost Chart). If that is not the case, the radius of the hole is simply set to the specified new hole radius.
If the specified Chart is the innermost Chart, however, some logic follows here. Firstly, we have the base case – if the pie Hole Radius is 0, the Pie Chart should be 100% filled, hence we do not draw the hole at all.
In other cases, we do some calculations. Firstly, we calculate the delta difference between the new hole radius, and the current pie hole radius: $$ \delta = h - r $$
Through longer calculations, we find that the delta value is, in fact, always positive in the range \([0, 100]\) (we will not perform these calculations here).
Then, we calculate and set the radius to the inner most Pie Chart. The calculation is as follows (here r is the hole radius to set to the Pie Chart): $$ r = h * (1 + \delta/100) $$
The formula was established while performing observations with various values. It seems that the bigger the difference between the current hole radius, and the new hole radius, the larger the hole radius should be of the innermost Pie Chart. As an example, consider the case where the Pie Chart’s hole only takes up 5% of the Pie Chart. In that case, the innermost Pie Chart’s radius should be very large (95%, to be precise), and thus the delta value should be low (in order to represent the very small hole of the 95% fill Pie Chart).
The reason why we don’t set the radius of the hole to the local pie hole radius property is for the cases where there are quite a few rings (more than 3, for instance). In those scenarios, the innermost Pie Chart simply becomes too large for all the outer rings, to the points where the innermost Pie Chart could be even 6 times larger than any outermost ring. Thus, these calculations are used to somewhat equalize the Pie Chart rings.
While there are, of course, many improvements that could be made here, this works as quite a good approximation of the real innermost Pie Chart ring radius.
Upon adding new data, the Pie Chart View has to be refreshed. Since we treat all the rings as a single Pie Chart, we must also take care of refreshing all the Pie Chart rings accordingly.
The only part that we need to take care about the rings is an extra offset. Since enabling automatic legend offsetting (making the Chart smaller to fit the legend) would displace the outermost Pie Chart to no longer align with the inner Pie Charts, we need to apply the same offset to all the Pie Chart rings whenever the Legend takes up more than 1 line.
As such, the Refresh method is implemented in the following way:
  @Override
  protected void Refresh(ChartDataModel model, List<Entry> entries) {
    // Update the ChartDataModel's entries
    model.getDataset().setValues(entries);

    // Update the Legend of the Chart with the stored custom Legend Entries
    chart.getLegend().setCustom(legendEntries);

    // Every Pie Chart (ring) has to be updated post-refresh
    for (PieChart pieChart : pieCharts) {
      // ... (Notify data set changed logic)

      // Update the Pie Chart Ring offsets (after Legend changing)
      updatePieChartRingOffset(pieChart);

      // Invalidate the Pie Chart ring for the changes to take effect
      // on the View itself.
      pieChart.invalidate();
    }
  }
Note how all the Pie Charts are iterated, and the Pie Chart ring offset is updated. The Pie Chart ring offset updating is done in the following way:
  private float bottomOffset = 0f;

  /**
   * Updates the offset of the specified Pie Chart ring accordingly
   * to the required height of the Legend.
   *
   * Since the Legend is drawn inside, an offset is needed so that the
   * rings of the Pie Chart do not overlap with the Legend that much.
   * @param pieChart  Chart to apply offset to
   */
  private void updatePieChartRingOffset(PieChart pieChart) {
    // Offset only has to be calculated once; Do so on the root Pie Chart
    // This is based on the assumption that this method is invoked from
    // a loop which loops through all Pie Charts.
    if (chart == pieChart) {
      // The chosen offset is dependent on the height required
      // by the Legend. The offset itself is divided by 2.5 to reduce the
      // offset (the value was chosen through trial and error. Values above
      // are too small, while dividers <= 2 are too big in most cases)
      // The offset is capped at 25 (value was chosen through observations)
      // to prevent excess downsizing of inner Pie Charts.
      float dpNeededHeight = Utils.convertPixelsToDp(chart.getLegend().mNeededHeight);
      bottomOffset = dpNeededHeight / 2.5f;
      bottomOffset = Math.min(25f, bottomOffset);
    }

    // Set the bottom offset to the indicated Pie Chart and
    // recalculate offsets to update straight away.
    pieChart.setExtraBottomOffset(bottomOffset);
    pieChart.calculateOffsets();
  }
Except for the conversion from pixels to dp, the calculation formula for the offset is quite simple (where o is the offset, l is the legend’s needed height in dp): $$ o = min( l/2.5, 25 ) $$
In order for the Pie Charts to not become too small when applying the offset, the offset is capped at a value of 25.
Otherwise, the formula is based on some manual observations. It seems that using the needed height straight away as the offset applies an offset that is far too large. A division of 2 is also quite large in certain cases, creating gaps that are too big. The value of 2.5 was settled for as a constant of applying the offset.
Again, there could be quite a few improvements on this part, but it works relatively well for reasonable amounts of entries in the Pie Chart.
For the curious readers, the pull requests related to the Pie Chart type can be found here:
This has been a post following up on the 5 Chart types which were planned to be implemented in the scope of the 3 months for the project. The post that will follow after this one will be the last post detailing the features, and will cover the last Chart type that we have not covered – the Bar Chart, as well as various styling properties introduced for the Chart components.
Stay tuned!
Overview In the last post, I have thoroughly covered the implemented Pie Chart type for the App Inventor Chart components project that I have been working on...
Overview Last post, I have wrapped up the implemented methods for importing data to the Charts for the App Inventor Charts project that I have been working o...
Overview In the previous post on the App Inventor Chart Components project, I have covered data importing from Files, as well as from the Web. Previously, we...
Overview In the previous post on the App Inventor Chart Components project, we have looked at an extensive description of Chart Data Source concepts and real...
Overview It has been a while since the last post due to a highly busy period! A lot of blog posts were postponed, but now a series of posts will follow in th...
Overview Following up on the App Inventor Chart components project, this blog post will focus on a specific workflow aspect that allows to select the Chart t...
Overview With the workflow for the App Inventor Chart components established, the next step is to define the concepts and format of the Data that can be impo...
Problem While working with Charts in Android using the MPAndroidChart library, one inconsistency that I stumbled upon is the fact that all the Charts support...
Overview In the last post, I have previewed the workflow of the Charts components that I am working on for App Inventor. In this post, I will dive into some ...
Overview Following up on the Chart prototypes, this post will focus on previewing the current progress on the Charts components in App Inventor.
Overview In continuation to the previous previous blog post, this post will focus on a Line Chart Component prototype in App Inventor.
Overview During the initial steps of the project to develop Chart Components for App Inventor, the major focus was on the design of the components such that ...
As the community bonding period is nearing to an end and the coding period is about to begin, I would like give a status update on what happened in the last ...
Introduction I am Evaldas Latoškinas, currently a first year Computer Science & Engineering international student in the Netherlands at TU Delft. Origina...