App Inventor Chart Components: Project Summary
In the previous post on the App Inventor Chart Components project, I have covered data importing from Files, as well as from the Web. Previously, we have also seen data importing from TinyDB and CloudDB components, and we have also seen the concept of Observable Data Sources throughout the two posts. This post will focus on the final type of Data Sources – Real Time Data Sources.
Firstly, let’s recall the hierarchy of Chart Data Sources:
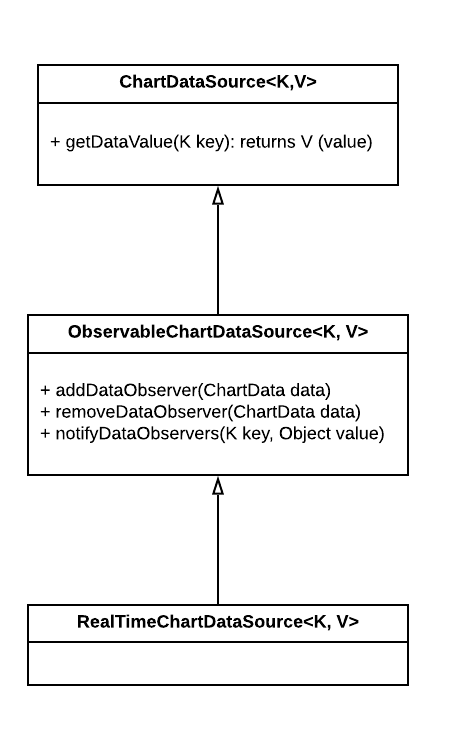
Note how the Real Time Chart Data Source interface directly extends from the Observable Chart Data Source interface. This has been done due to the following observations about Real Time Chart Data Sources:
As we can see, the Real Time Chart Data Source and the Observable Chart Data Source interfaces are very similar. The key difference between the two interfaces is that the Observable Chart Data Source changes its data, while the Real Time Chart Data Source keeps sending new data (and does not otherwise store the old data)
The RealTimeChartDataSource interface, on it’s own, is very simple:
/**
 * Interface for observable real-time data
 * producing Chart Data Source components.
 *
 * @param <K>  key (data identifier)
 * @param <V>  value (returned data type)
 */
public interface RealTimeChartDataSource<K, V> extends ObservableChartDataSource<K, V> {
}
In reality, the interface is needed mainly only to differentiate Real Time Chart Data Sources from the Observable Chart Data Sources, therefore it does not come with any extra methods.
Chart Data components have a corresponding interface to listen for Real Time Chart Data Source events:
/**
 * Interface for receiving real time data from a Chart Data Source.
 */
public interface ChartDataSourceGetValueListener {
  /**
   * Event called when a new real time value is sent to the observer.
   *
   * @param component  component that triggered the event
   * @param key  identifier of the value
   * @param value  value received
   */
  public void onReceiveValue(RealTimeChartDataSource component, String key, Object value);
}
The interface is very similar to the ChartDataSourceChangeListener seen before, except that the method name differs, as it is applied for a different case. In order to not make the interface for receiving ObservableChartDdataSource eveents even more complex, a separate interface has been made to handle value receiving events.
When thinking about real time sources, the first, and easiest way to apply and test the defined concepts were using the pre-existing Android Sensor components which require minimal setup.
Now we are going to look at adapting a few Sensor components to function as Real Time Chart Data Sources.
The first sensor that I went around to implementing as a Real TIme Data Source was the Accelerometer Sensor component.
For context, the AccelerometerSensor produces and updates the following values:
With these values in mind, and the fact that we would like to plot different values (and perhaps even all of them via multiple Data Series), we then define the key values as follows:
The first step is to actually implement the RealTimeChartDataSource interface in the existing AccelerometerSensor:
public class AccelerometerSensor extends AndroidNonvisibleComponent
    implements RealTimeChartDataSource<String, Float> { // (other implemented interfaces omitted for brevity)
      // ...
    }
The key is a String (X, Y or Z), and the value is a float, since the values produced by the sensor are numeric.
Next, in the class itself, we implement the methods required to observe the AccelerometerSensor:
  // Set of observers
  private HashSet<ChartDataBase> dataSourceObservers = new HashSet<ChartDataBase>();

  @Override
  public void addDataObserver(ChartDataBase dataComponent) {
    dataSourceObservers.add(dataComponent);
  }

  @Override
  public void removeDataObserver(ChartDataBase dataComponent) {
    dataSourceObservers.remove(dataComponent);
  }

  @Override
  public void notifyDataObservers(String key, Object value) {
    // Notify each Chart Data observer component of the Data value change
    for (ChartDataBase dataComponent : dataSourceObservers) {
      dataComponent.onReceiveValue(this, key, value);
    }
  }
The code is highly similar to the code we have seen before for the other Observable Chart Data Sources, and handles simple, basic functionality of adding, removing and informing Data Source Observers of new data. Note that the onReceiveValue method is called on Data Components in the notifyDataObservers method.
Next, we implement the getDataValue method to return the appropriate values:
  @Override
  public Float getDataValue(String key) {
    switch (key) {
      case "X":
        return xAccel;

      case "Y":
        return yAccel;

      case "Z":
        return zAccel;

      default:
        return 0f;
    }
  }
Here we make use of the defined key values for each dimension, and return the corresponding value.
Finally, in order to send the data to the Chart Data component, we add the following lines to the AccelerationChanged Event:
  /**
   * Indicates the acceleration changed in the X, Y, and/or Z dimensions.
   */
  @SimpleEvent
  public void AccelerationChanged(float xAccel, float yAccel, float zAccel) {
    this.xAccel = xAccel;
    this.yAccel = yAccel;
    this.zAccel = zAccel;

    // ...

    // Notify the Data Source observers with the updated values
    notifyDataObservers("X", xAccel);
    notifyDataObservers("Y", yAccel);
    notifyDataObservers("Z", zAccel);

    // ...
  }
We essentially inform all Data Observers with the value changes of all 3 values, with the corresponding key. It is then up to the Chart Data component to interpret the value.
With this implementation in place, we have essentially adapted the AccelerometerSensor to be a fully compatible real time Chart Data Source.
Now, let’s take a look at another sensor which was also made to be Chart Data compatible.
The Pedometer is a sensor which keeps track of the number of steps taken, and the total distance travelled.
The Pedometer, in essence, has the same characteristics as the Accelerometer Sensor as a Real Time Chart Data Source – the key values are Strings, the data values are Floats, and the observing process is the same. The only difference is in the values, and the events which trigger the data updating.
The key values are summarized by the getDataValue method:
  @Override
  public Float getDataValue(String key) {
    switch (key) {
      case "SimpleSteps":
        return (float) numStepsRaw;

      case "WalkSteps":
        return (float) numStepsWithFilter;

      case "Distance":
        return totalDistance;

      default:
        return 0f;
    }
  }
With regards to data value updating, let us consider the two Events which update the step count:
  /**
   * Indicates that a step was taken.
   *
   * @param simpleSteps number of raw steps detected
   * @param distance approximate distance covered by number of simpleSteps in meters
   */
  @SimpleEvent(description = "This event is run when a raw step is detected")
  public void SimpleStep(int simpleSteps, float distance) {
    // Notify Data Observers with changed SimpleSteps and Distance values
    notifyDataObservers("SimpleSteps", simpleSteps);
    notifyDataObservers("Distance", distance);

    EventDispatcher.dispatchEvent(this, "SimpleStep", simpleSteps, distance);
  }

  /**
   * Indicates that a step was taken while walking. This will not be called if
   * a single step is taken while standing still.
   *
   * @param walkSteps number of walking steps detected
   * @param distance approximate distance covered by the number of walkSteps in meters
   */
  @SimpleEvent(description = "This event is run when a walking step is detected. " +
    "A walking step is a step that appears to be involved in forward motion.")
  public void WalkStep(int walkSteps, float distance) {
    // Notify Data Observers with changed WalkSteps and Distance values
    notifyDataObservers("WalkSteps", walkSteps);
    notifyDataObservers("Distance", distance);

    EventDispatcher.dispatchEvent(this, "WalkStep", walkSteps, distance);
  }
The only lines that were added were the notifyDataObservers method calls in order to notify all the observers of data updating. With this implementation, we have fully adapted the Peodmeter to act as a real time Chart Data Source.
Let’s take a look at another example of a sensor implementation to act as a real time Chart Data Source – the LocationSensor.
The sensor updates the longitude, latitude, altitude and the speed observed by the device.
The getDataValue summarizes the key values in use for the Sensor:
  @Override
  public Float getDataValue(String key) {
    switch (key) {
      case "latitude":
        return (float) latitude;

      case "longitude":
        return (float )longitude;

      case "altitude":
        return (float) altitude;

      case "speed":
        return speed;

      default:
        return 0f;
    }
  }
In order to send the data to the observers, the following 4 method calls are added to the LocationChanged event, which is responsible for updating the parameters:
  /**
   * Indicates that a new location has been detected.
   */
  @SimpleEvent
  public void LocationChanged(double latitude, double longitude, double altitude, float speed) {
    notifyDataObservers("latitude", latitude);
    notifyDataObservers("longitude", longitude);
    notifyDataObservers("altitude", altitude);
    notifyDataObservers("speed", speed);

    EventDispatcher.dispatchEvent(this, "LocationChanged", latitude, longitude, altitude, speed);
  }
With this implementation, we have made the LocationSensor to function as a fully observable real time Chart Data Source.
Amongst the presented Sensors, the following sensors are also supported as Real Time Chart Data Sources:
Since the behavior is very similar to the presented sensors, and only the type of data is different, we will not go into detail on these sensor importing options. As we have seen, the implementation for each Sensor is very similar, and in fact, in the future we could create an abstract class which handles most of the functionality for us and requires minimal changes to create observable sensor components.
After implementing the Android Sensors, another possibility of a Data Source is the BluetoothClient component, which connects the device to a Bluetooth component, and allows data to be read.
An example use case of such a data importing method is connecting an Arduino via Bluetooth to the phone, then sending data from the Arduino via the Bluetooth connection, and then plotting the data on a Chart.
The BluetoothClient is a rather interesting case in terms of observing due to the data coming in via an InputStream and the lack of observability of a Bluetooth connection in general.
However, the BluetoothClient API allows to check whether the client is connected, and whether bytes are available to be read.
Due to the lack of observability, the idea is to then poll for data in a fixed rate, constantly checking for data, and sending the data to the observers if data was read.
Moreover, an important thing to note is that data is read as a stream from the Bluetooth connection, meaning that the data comes in as a byte stream. To differentiate the values to use as the imported values, we use a delimiter to detect the end of the value.
To further illustrate this, consider that the Bluetooth connection sends the numbers 1, 2, … and so on in increasing order. As a stream, the data looks as follows:
12345678910In fact, there is no logical way to differentiate this data. On the side of the Android implementation, we cannot know whether the intended numbers were 1, 2, 3, …, or if it was the single number 12345678910.
To circumvent this, the BluetoothClient actually allows the use of a delimiter byte which is used to distinguish separate values. Therefore, if on the Bluetooth connection side the data would be sent in the following format:
1\2\3\4\5\6\7\8\9\10\We could then use the character ** as the delimiter to retrieve the value 1, 2, 3 and so on.
Another point to take care of is importing different data from a single Source. Consider the scenario where we have a single Arduino, and we would like to send different data, and plot them on separate Data Series (e.g. separate lines). Right now, we have the same data for all the Data Sources, and we cannot do much differentiation there, since all of the data is sent via the same stream.
However, we can introduce prefixes to mark the data. For example, consider the situation where we would like to send and receive both humidity and temperature via the Bluetooth connection. We could then send the data as follows:
t:21\n
h:35\n
Here, we use two prefixes: t: for temperature, and h: for humidity (as well as the delimiter \n). If we specify the prefix to read data from for the Data Series, we can then effectively feed different data to different Data Sources, all with a single Bluetooth device.
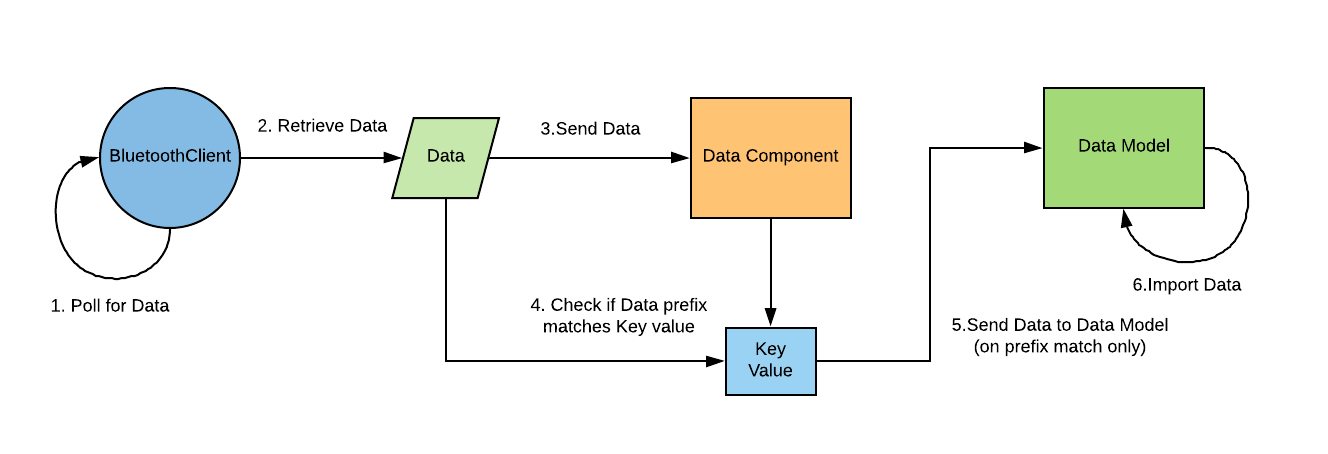
The idea & process can be summarized by the following illustration:
Let us now take a look at the implementation itself.
The first step is to implement the RealTimeChartDataSource interface for the BluetoothClient:
public final class BluetoothClient extends BluetoothConnectionBase
        implements RealTimeChartDataSource<String, String> {
  // ...
}
The interesting part here is that both the key and the value are Strings. The reason this choice was made is because of an implementation implication. Consider the scenario where we would like to extract a Data value from a String which contains both a prefix, and a value. Now, suppose we use a numeric prefix, for instance the number 1. Then we receive the following data:
12The real value is, in fact, 2, while the prefix is 1. Again, we have no real way of detecting which part is the prefix, and which part is the data without having the prefix beforehand. As it turns out, the prefix is, in fact, a variable in the Chart Data component. Due to this reason, it was decided to leave it up for the Chart Data Source component to interpret the data values. As such, the BluetoothClient does not actually have a key value in it’s internal implementation. The key value is, figuratively, the prefix.
The getDataValue method looks as follows:
  @Override
  public String getDataValue(String key) {
    String value = "";

    // Ensure that the BluetoothClient is connected
    if (IsConnected()) {
      // Check how many bytes can be received
      int bytesReceivable = BytesAvailableToReceive();

      // At least one byte can be received
      if (bytesReceivable > 0) {
        // Read contents from the Bluetooth connection until delimiter
        value = ReceiveText(-1);
      }
    }

    return value;
  }
This method is used to instantly read data until the delimiter, and then return the result of reading. Data is only read if the BluetoothClient component is connected, and there is at least a single byte that is receivable over Bluetooth.
Note how the key value is not used at all; This is a design implication due to the chosen prefix parsing design.
The metohd used to notify Data Observers is the same as for the Sensor components:
  @Override
  public void notifyDataObservers(String key, Object newValue) {
    for (ChartDataBase observer : dataSourceObservers) {
      observer.onReceiveValue(this, key, newValue);
    }
  }
The differences in observing lie in the add and remove methods:
  @Override
  public void addDataObserver(ChartDataBase dataComponent) {
    // Data Polling Service has not been initialized yet; Initialize it
    // (since Data Component is added)
    if (dataPollService == null) {
      startBluetoothDataPolling();
    }

    // Add the Data Component as an observer
    dataSourceObservers.add(dataComponent);
  }

  @Override
  public void removeDataObserver(ChartDataBase dataComponent) {
    dataSourceObservers.remove(dataComponent);

    // No more Data Source observers exist;
    // Shut down polling service and null it
    // (the reason for nulling is so that a new
    // service could be created upon adding a new
    // observer)
    if (dataSourceObservers.isEmpty()) {
      dataPollService.shutdown();
      dataPollService = null;
    }
  }
The idea behind the dataPollService related method calls is the fact that the BluetoothClient component might be used outside of Chart related activity. As such, since the Data Poll Service reads in all the data (thus making the Read block calls no longer be able to retrieve the data), the service should only be started if a Data Observer is attached to the BluetoothClient. As such, the Data Polling service is only started whenever the first Data Observer is added, and if, after removal, no more Data Observers exist, the Data Poll Service should be shut down.
The polling itself is implemented as follows:
  // Executor Service to poll data continuously from the Input Stream
  // which holds data sent by Bluetooth connections. Used for sending
  // data to Data listeners, and only initialized as soon as an observer
  // is added to this component.
  private ScheduledExecutorService dataPollService;

  // Fixed polling rate for the Data Polling Service (in milliseconds)
  private static final int POLLING_RATE = 10;

  /**
   * Starts the scheduled Data Polling Service that
   * continuously reads data and notifies all the
   * observers with the new data.
   */
  private void startBluetoothDataPolling() {
    // Create a new Scheduled Executor. The executor is made single
    // threaded to prevent race conditions between consequent
    // Bluetooth reading as well as due to performance (since the
    // chosen polling interval is chosen to be quite small)
    dataPollService = Executors.newSingleThreadScheduledExecutor();

    // Execute runnable task at a fixed millisecond rate
    dataPollService.scheduleWithFixedDelay(new Runnable() {
      @Override
      public void run() {
        // Retrieve data value (with a null key, since
        // key value does not matter for BluetoothClient)
        String value = getDataValue(null);

        // Notify data observers of the retrieved value if it is
        // non-empty
        if (!value.equals("")) {
          notifyDataObservers(null, value);
        }
      }
    }, 0, POLLING_RATE, TimeUnit.MILLISECONDS);
  }
The idea behind this is to have a background task constantly running which attempts to read Data from the BluetoothClient. Provided that data exists (the client is connected, and at least a single byte can be retrieved), the observers are then notified of the new value.
Let’s consider an example app. Suppose we would like to plot the temperature and the humidity on a single Line Chart.
We will use the prefix t: for the temperature, and h: for humidity. For the delimiter, we will use the newline character \n.
Provided that we connect our BluetoothClient correctly, we would additionally specify the following Designer properties for the Bluetooth Client, and for the Chart Data components:
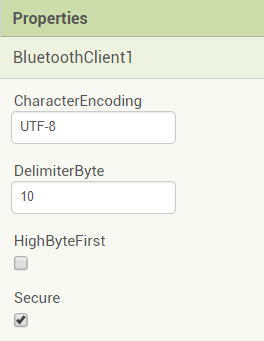
For the BluetoothClient, we set the DelimiiterByte to 10, which corresponds to the LF newline character (by the ASCII table)
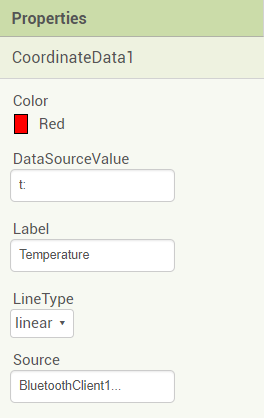
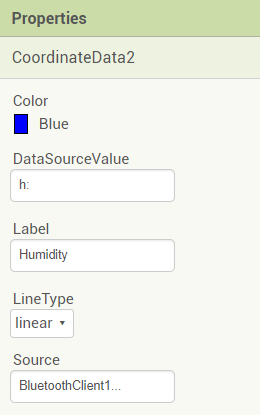
For the Data Series, we use the BluetoothClient as the Source property, and we specify the corresponding prefixes as the DataSourceValues (t: for temperature and h: for humidity)
For the Arduino, we then create the following simple project which makes use of data read in from a DHT sensor:
#include <SoftwareSerial.h>
#include "DHT.h"

SoftwareSerial EEBlue(10, 11); // RX | TX

#define DHT_PIN 7
#define DHT_TYPE DHT11

DHT dht(DHT_PIN, DHT_TYPE);

void setup() {
  EEBlue.begin(9600); // Default Band for comm.

  dht.begin();
}

void loop() {
  delay(2000);

  float t = dht.readTemperature();
  float h = dht.readHumidity();

  EEBlue.println("t:" + String(t));
  EEBlue.println("h:" + String(h));
}
The simple Arduino code does the following:
The Arduino setup itself looks like this:
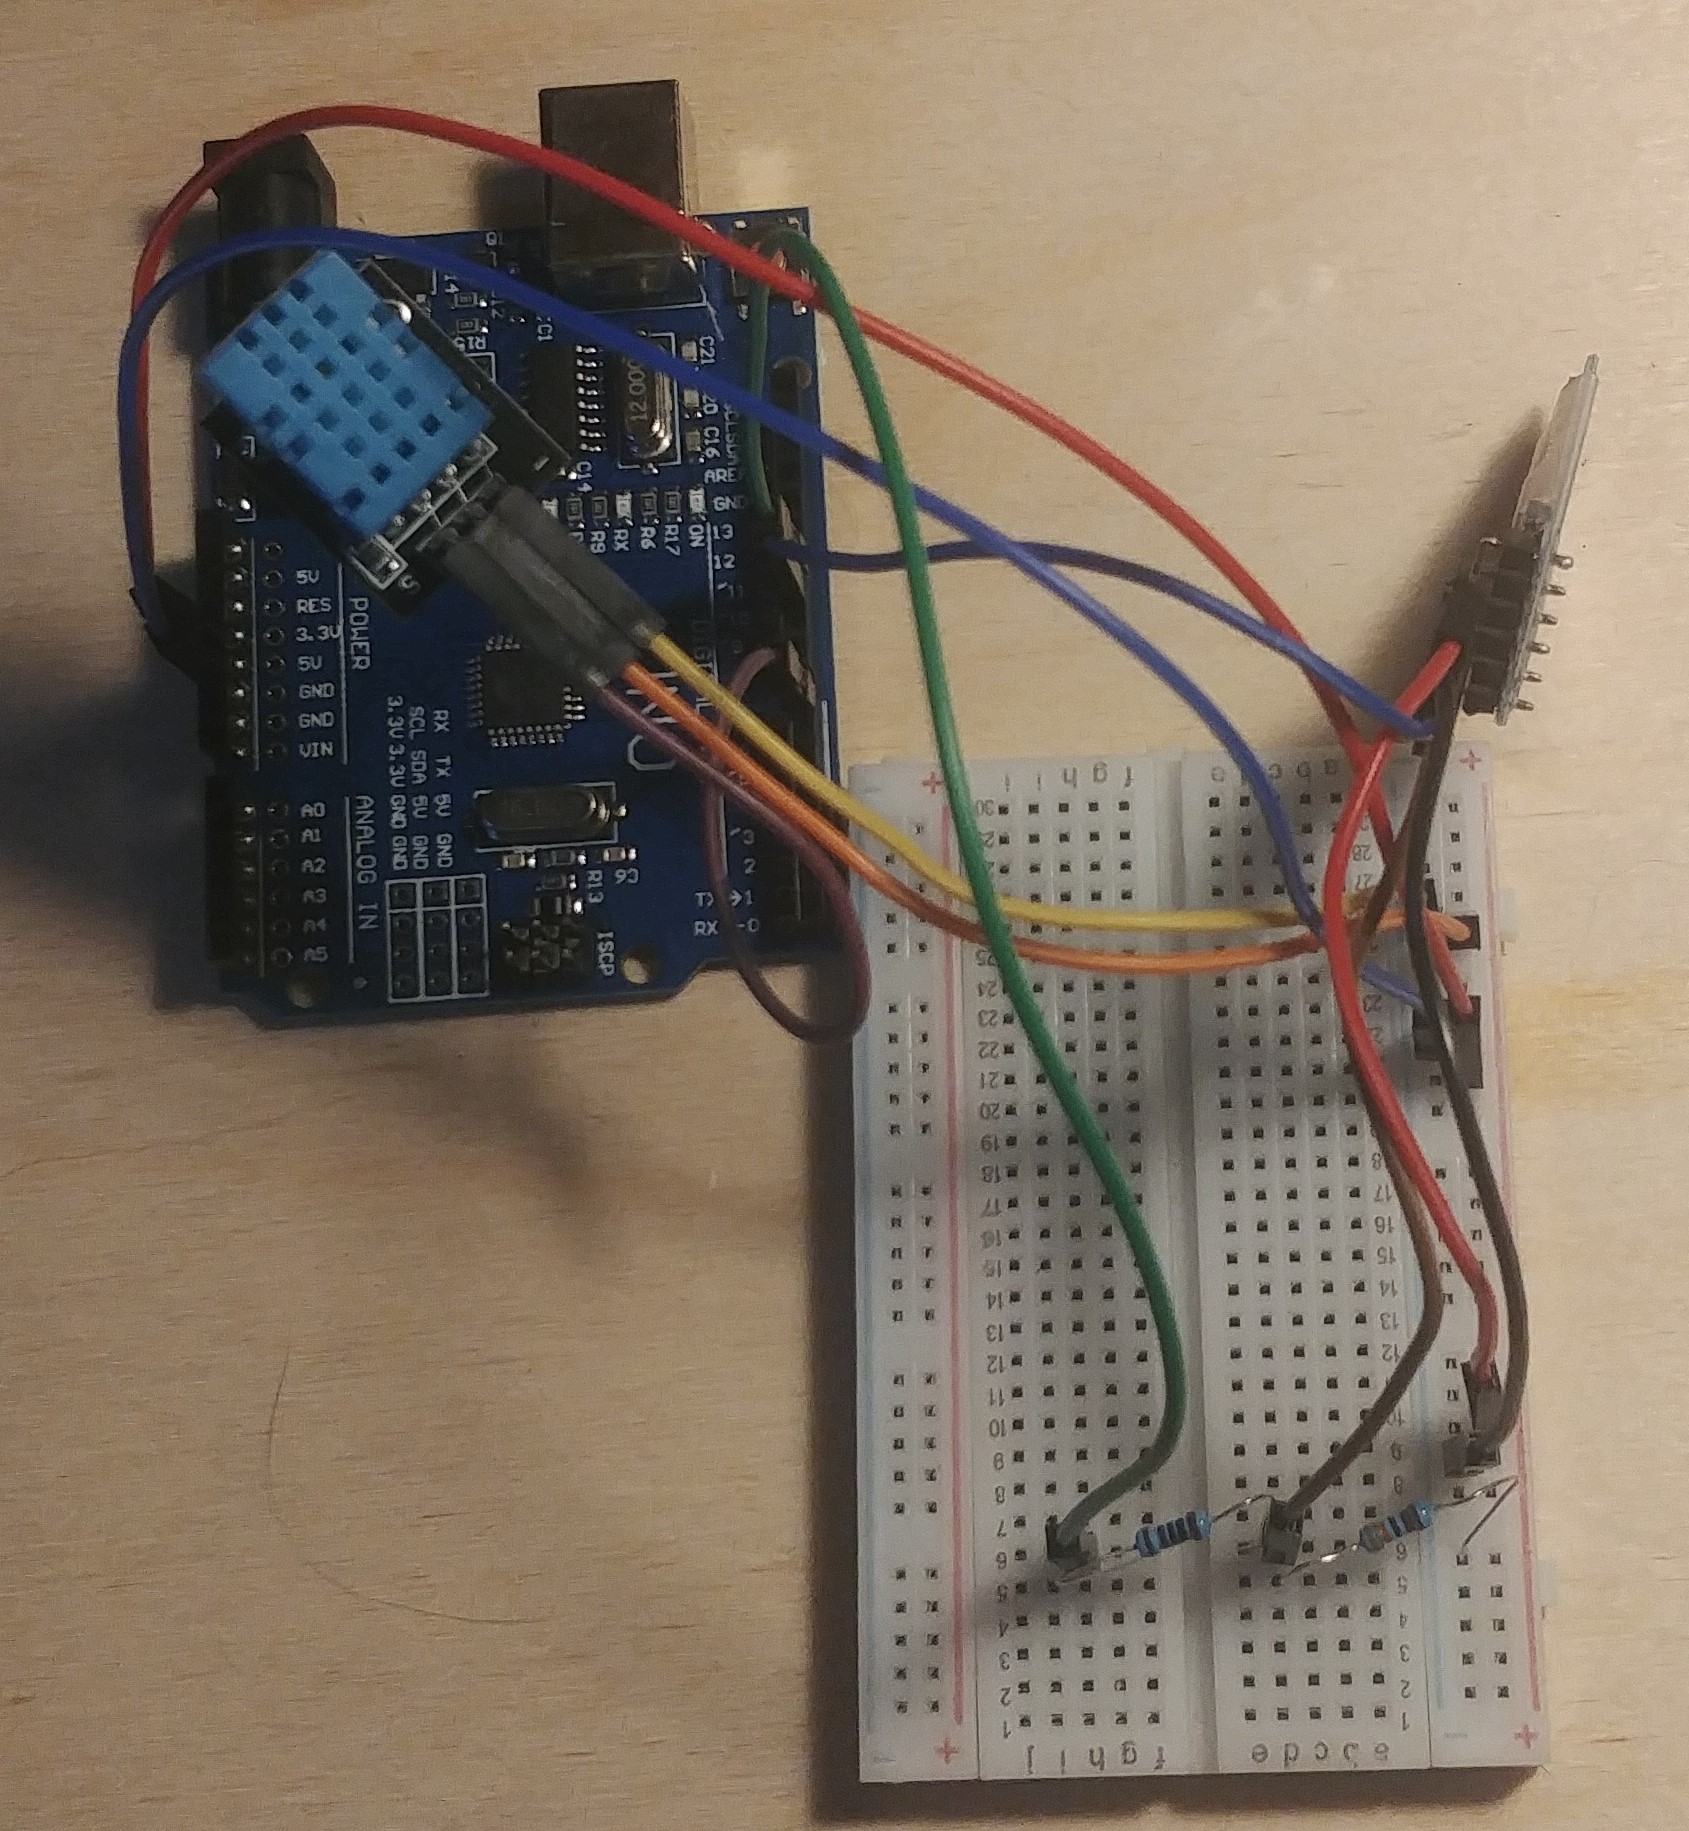
In essence, in the setup, the DHT11 temperature and humidity sensor is connected to pin 7 to provide input to it, as well as to the breadboard to power on the sensor.
The HC05 Bluetooth Module is connected to pins 10 and 11 and powered on to allow Bluetooth connections to the Arduino, which in turn allows sending the temperature and sensor data to the device.
This animation illustrates the resulting Line Chart which plots real time data:
Finally, let us take a look at the bulk of the code that handles the actual value receiving in the Chart Data components:
    @Override
    public void onReceiveValue(RealTimeChartDataSource component, final String key, Object value) {
        // Boolean to indicate whether data should be imported (conditions
        // for importing are satisfied)
        boolean importData = false;

        // BluetoothClient requires different handling due to value format
        // expected to be with a prefix (prefix||value)
        if (component instanceof BluetoothClient) {
            // Get the imported value as a String
            String valueString = (String) value;

            // Check whether the retrieved value starts with the local
            // dataSourceValue (which indicates the prefix)
            importData = valueString.startsWith(dataSourceValue);

            // Data should be imported (prefix match)
            if (importData) {
                // Extract the value from the retrieved prefix||value pair
                // The extraction is done by cutting off the prefix entirely.
                value = valueString.substring(dataSourceValue.length());
            }
        } else {
            // Check that the key of the value received matches the
            // Data Source value key
            importData = key == null || key.equals(dataSourceValue);
        }

        if (importData) {
            // Get value as final value to use for the runnable on UI thread
            final Object finalValue = value;

            // Import value in non-async (since this is a real-time value,
            // the update will come faster than running in async)
            // Importing the value asynchronously could cause more
            // race conditions between data series (as well as added tearing)
            container.$context().runOnUiThread(new Runnable() {
                @Override
                public void run() {
                    // Get the  t value synced across the entire Chart
                    // and update the synced value if necessary
                    t = container.getSyncedTValue(t);

                    // Create tuple from current t value and the received value
                    final YailList tuple = YailList.makeList(Arrays.asList(t, finalValue));

                    chartDataModel.addTimeEntry(tuple);
                    refreshChart();

                    // Increment t value
                    t++;
                }
            });
        }
    }
The rather lengthy method consists of two parts – determining whether data can be imported from the retrieved value to the current Chart Data component, and then actually importing the data to the Data Series.
With regards to the BluetoothClient component, the data is only imported if the retrieved value starts with the local DataSourceValue property, which corresponds to the prefix to use for the BluetoothClient Data Source. If that is the case, the actual value is extracted by cutting off the prefix off the retrieved value.
In the usual case (for the Sensors), the data is imported either if the key is null (all Data Observer convention), or if the key equals the local DataSourceValue.
If it the criterion for importing the data is satisfied, the data is then imported on the UI thread. The reason this is done is since the data arrives in real time, the updates come in faster on the UI thread, and tearing is also prevented upon Chart refreshes.
With regards to data importing, the t value is retrieved from the parent Chart component. Since multiple Data Series could all be time series, the Chart component itself is then designated to take care of syncing the t value across the entire Chart. The t value itself represents the current x value to use to represent the time.
A local reference of the t value is kept to pass in as an argument. For now, we will not go into the details of the getSyncedTValue method in this post, since the method is in quite an early stage.
With this implementation in mind, the Chart Data components are now able to accept data from all Real Time Chart Data Sources that were described in the post.
For the curious readers, the pull requests related to implementing Real Time Chart Data Source importing can be found here:
This has been the final post covering the implemented Chart Data Importing options. Future posts will cover the last two Chart types scoped for the project – the Bar Chart, and the Pie Chart.
Stay tuned!
Overview In the last post, I have thoroughly covered the implemented Pie Chart type for the App Inventor Chart components project that I have been working on...
Overview Last post, I have wrapped up the implemented methods for importing data to the Charts for the App Inventor Charts project that I have been working o...
Overview In the previous post on the App Inventor Chart Components project, I have covered data importing from Files, as well as from the Web. Previously, we...
Overview In the previous post on the App Inventor Chart Components project, we have looked at an extensive description of Chart Data Source concepts and real...
Overview It has been a while since the last post due to a highly busy period! A lot of blog posts were postponed, but now a series of posts will follow in th...
Overview Following up on the App Inventor Chart components project, this blog post will focus on a specific workflow aspect that allows to select the Chart t...
Overview With the workflow for the App Inventor Chart components established, the next step is to define the concepts and format of the Data that can be impo...
Problem While working with Charts in Android using the MPAndroidChart library, one inconsistency that I stumbled upon is the fact that all the Charts support...
Overview In the last post, I have previewed the workflow of the Charts components that I am working on for App Inventor. In this post, I will dive into some ...
Overview Following up on the Chart prototypes, this post will focus on previewing the current progress on the Charts components in App Inventor.
Overview In continuation to the previous previous blog post, this post will focus on a Line Chart Component prototype in App Inventor.
Overview During the initial steps of the project to develop Chart Components for App Inventor, the major focus was on the design of the components such that ...
As the community bonding period is nearing to an end and the coding period is about to begin, I would like give a status update on what happened in the last ...
Introduction I am Evaldas Latoškinas, currently a first year Computer Science & Engineering international student in the Netherlands at TU Delft. Origina...