App Inventor Chart Components: Project Summary
During the initial steps of the project to develop Chart Components for App Inventor, the major focus was on the design of the components such that there is an agreement between different parties that use and work on App Inventor, including the developer team, staff members, representatives in education departments as well as active users of the App Inventor community.
After making a few important design decisions, the goal is then to make a few prototypes for presentation purposes to make some final decisions on how the interaction with the components works, how they should be implemented and what other design features should be taken into account. I will touch upon prototyping in a subsequent blog post.
Designing is a process that can last as long as the project is maintained and worked on, and as such, the designs made in the early stages of the project are nowhere near to being finished. However, a general, broad view of some important aspects has been established.
Part of the design was choosing the libraries to represent the Charts. A bit of context on App Inventor to the unfamiliar readers – the components in App Inventor are basically separated into two graphical parts - the one that is seen when actually creating the applications in the browser, and the one that actually appears when using the application in Android. Due to App Inventor running on GWT (a web-based platform), and the Android platform being completely separate from the browser, the components internally are actually separate and require their own code (one part for Android, one part for GWT), and they are typically made to look alike.
This posed quite a difficult challenge to decide on the libraries. Initially, there were thoughts of finding a library supporting both the web and Android. However, that proved to be basically unachievable for an open source project, due to most cross-platform libraries being targeted at commercial users.
The final decision was then to use two different libraries. For Android, we decided to use MPAndroidChart, a well-supported, highly documented and up-to-date Android charting library.
As for the Web, the decision is yet to be made. But the general idea that we will likely take is using a JavaScript-based library and adapting it to GWT.
Having two different libraries in the end proved to be somewhat an advantage, since the variety of Charting libraries is quite vast.
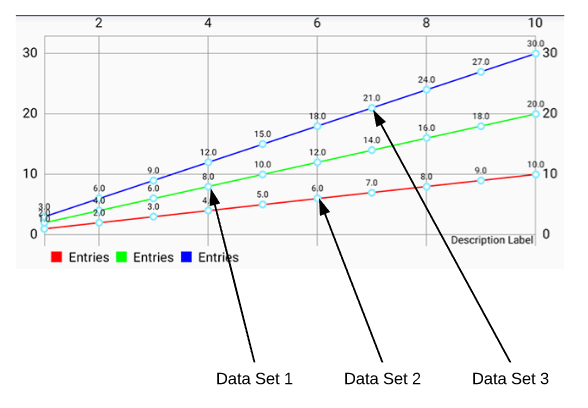
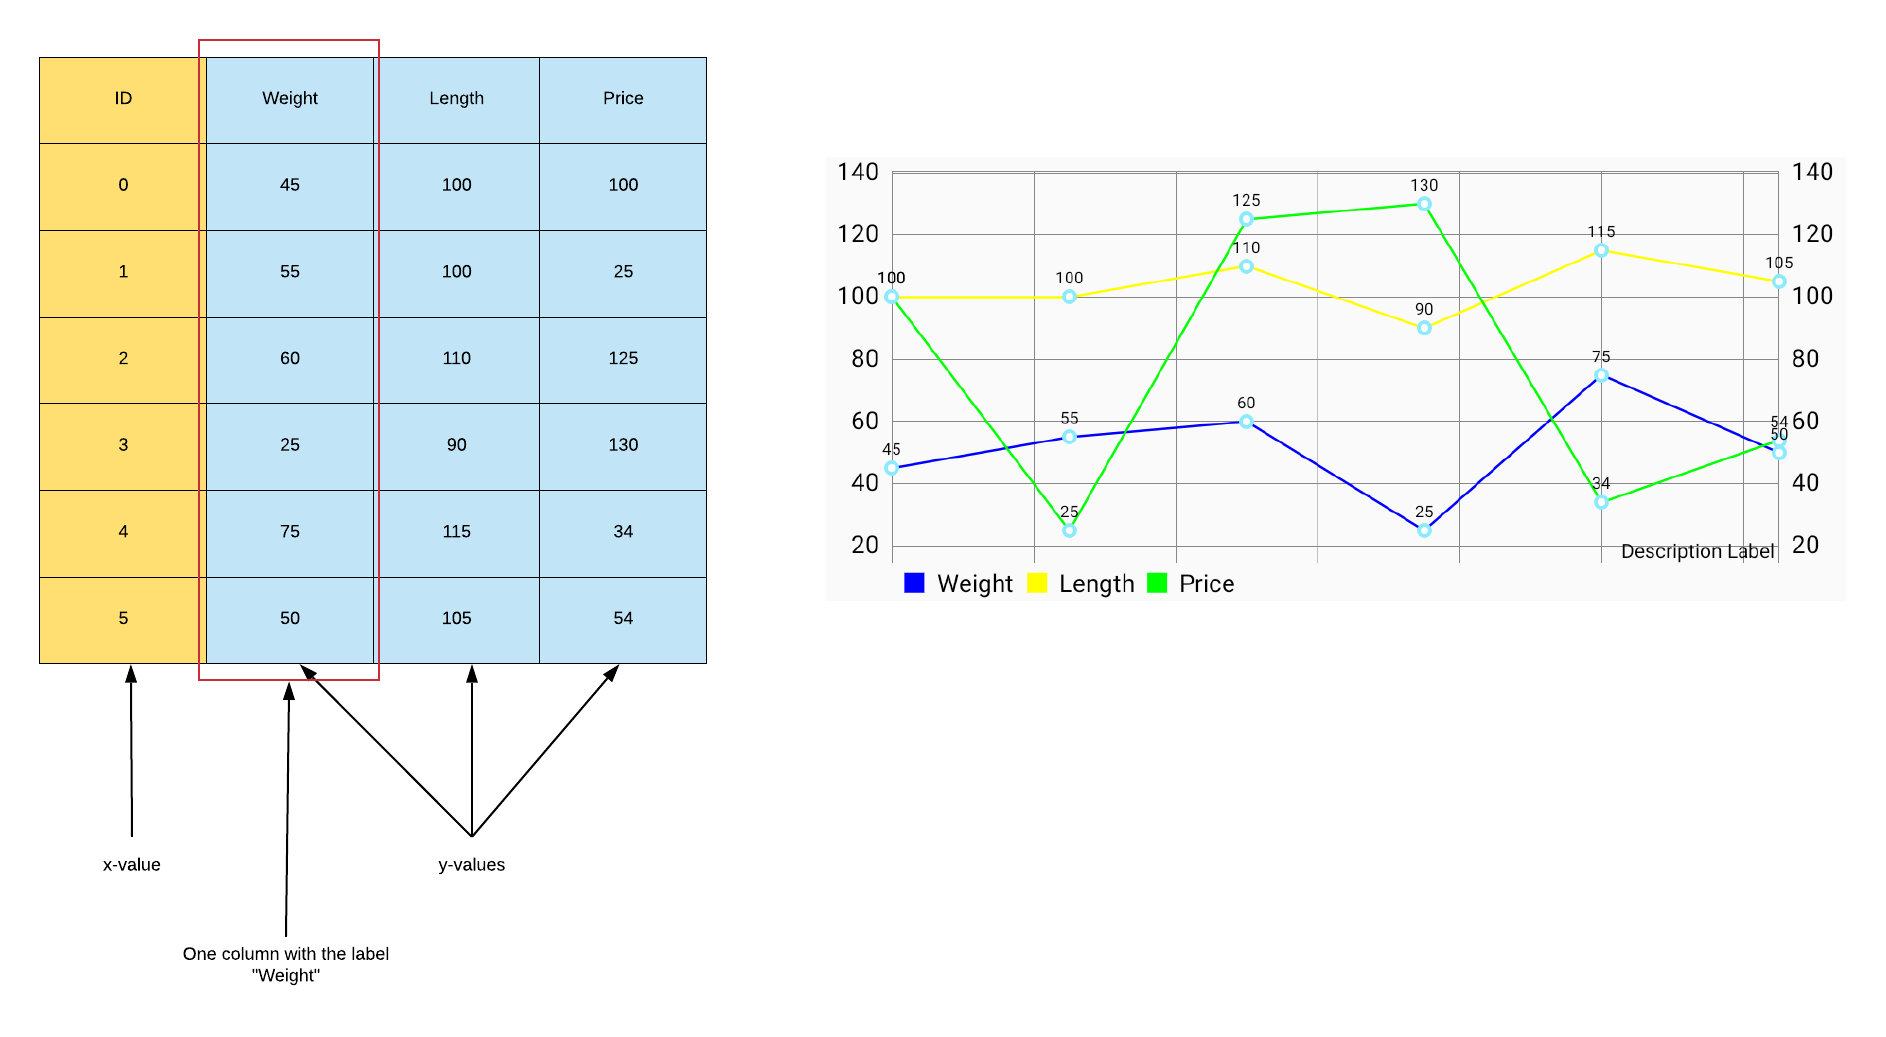
A simple approach that I took when starting to design is to define how Chart data should be interpreted. One of the key goals set for the project was that a Chart could contain more than one series of data, meaning a Line Chart could have more than one line, for example.
Throughout this blog post, I would like to define a few terms that I will use throughout (although they might not be fully accurate):
For a visual representation of how the data would be interpreted, here are some examples:
In the general sense, Charts consist of two components - the view (GUI) and the data (logic). With these properties in mind, a few models of representing the components in App Inventor have been considered.
The idea of this approach is simple – simply couple the view and data together (at least from the User’s perspective). The user could then add data via methods that are on the Chart components, and would not have to use any extra components.
An alternate approach currently considered is to have the Chart component and the Data component separate. With this separation, a Data component would attach to the Chart, and then the Chart would load the data from the component. This would provide a more logical decoupling, with each component responsible for a smaller part of the overall functionality – the view and the data, respectively.
Multiple models have been devised for this concept.
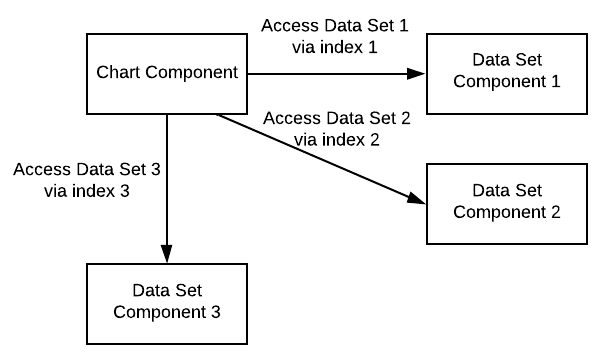

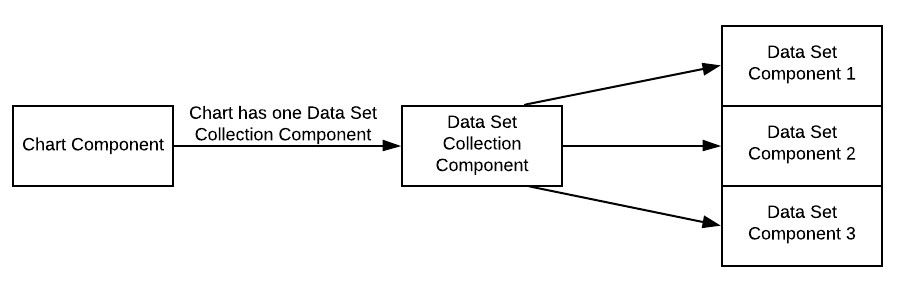
Each model has its own implications. For instance, the model where a Chart component has many Data Set components attached to it makes styling individual data sets seemingly difficult, but provides great modularity, even allowing to reuse single data sets in other Charts. For another example, the model in which a Chart has a single Data Set Collection component which references Data Sets inside it via index makes it difficult for the User to keep track of their data sets, and then the data is no longer really modular, since everything is put under one component.
There is still quite a lot of discussion on this topic, and a final decision is yet to be made.
Going a bit into implementation, some UML diagrams were established for Chart and Data Set components. The hierarchies will most likely change in the future, and a decision to first prototype the Components before abstracting them was made.
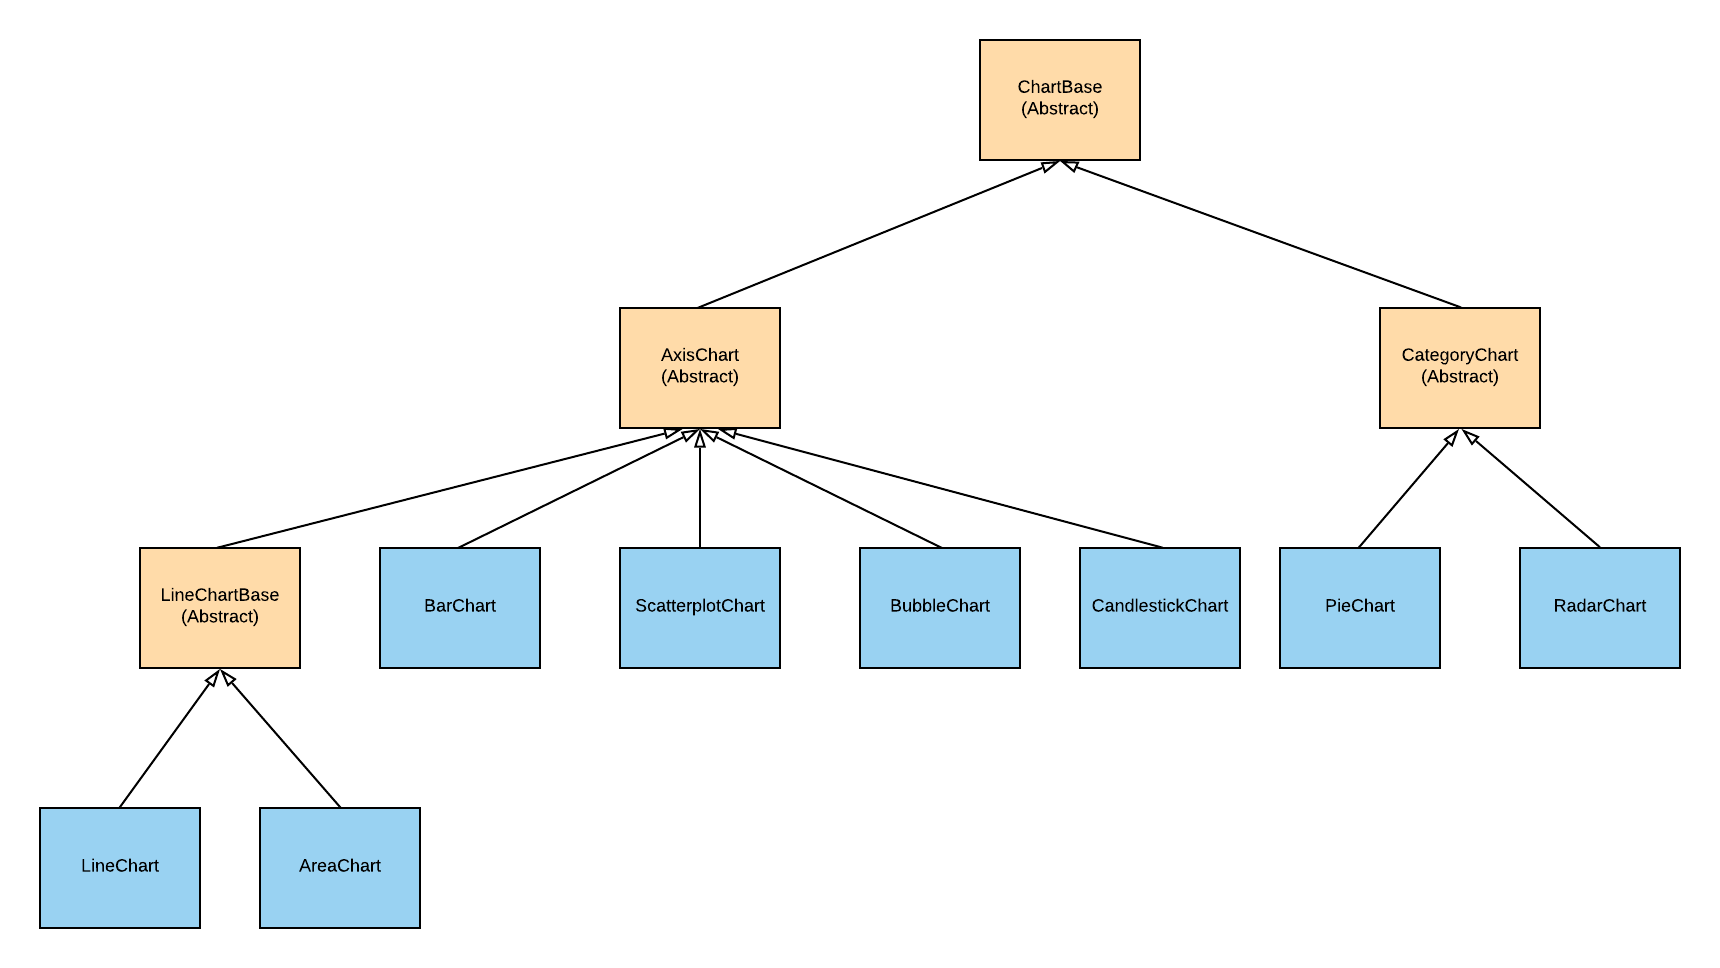
For the Chart abstractions, the general idea is to have final, non-abstract classes be the actual useable Charts themselves. There are a few layers of abstraction, however.
The first obvious one is the ChartBase, which holds functionality and properties mutual to all the Charts. As much generalization as possible should go into this class to allow the implemented classes to focus on their own respective functionality.
Then we have the AxisChart and CategoryChart abstractions. The idea is that since there are Charts which have an axis, and Charts which don’t, two different broader types exist, and they can be separated. The AxisChart would then have added functionality for handling the Axis settings. The CategoryChart abstraction may or may not be needed (ChartBase might be sufficient), but for now, the decision was to keep it in the UML model.
And finally, there’s the LineChartBase, the idea of which is because LineChart and AreaChart are both Line Charts, they would inherit from one single base class, and have different preset settings (AreaChart would fill the area it covers)
The main Chart Data hierarchy considered is to have one Data Set type per Chart. The BaseDataSet abstraction is similar to the ChartBase abstraction. The CoordinateDataSet abstraction would represent classes that have ordinary (x, y) coordinates with perhaps one added field (which applies to BubbleDataSet).
Finally, some initial thoughts on data importing have been modelled. The project aims to support multiple data sources – manually inputted data, data coming from a database, data coming from the web, file importing and real-time sensor data.
Although there is still quite a way to go before beginning to deal with non-manual data, a basic design model has been established:
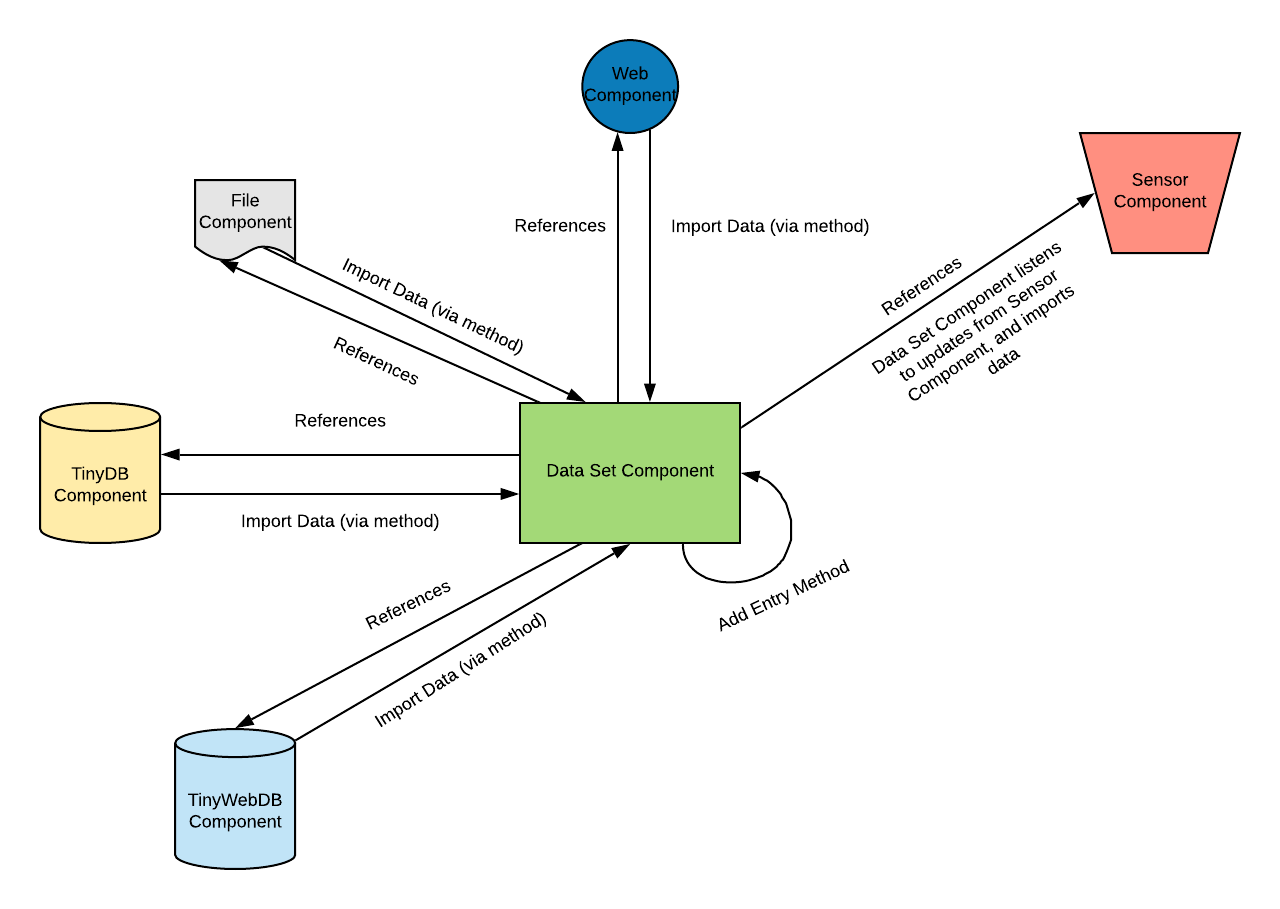
Details on this will follow, as this design is in an early stage.
With some key aspects of the project being designed and considered, the next step is to build some prototypes and then choose which one would be better by collecting feedback. The next blog post will cover some development details of the prototypes.
Stay tuned!
Overview In the last post, I have thoroughly covered the implemented Pie Chart type for the App Inventor Chart components project that I have been working on...
Overview Last post, I have wrapped up the implemented methods for importing data to the Charts for the App Inventor Charts project that I have been working o...
Overview In the previous post on the App Inventor Chart Components project, I have covered data importing from Files, as well as from the Web. Previously, we...
Overview In the previous post on the App Inventor Chart Components project, we have looked at an extensive description of Chart Data Source concepts and real...
Overview It has been a while since the last post due to a highly busy period! A lot of blog posts were postponed, but now a series of posts will follow in th...
Overview Following up on the App Inventor Chart components project, this blog post will focus on a specific workflow aspect that allows to select the Chart t...
Overview With the workflow for the App Inventor Chart components established, the next step is to define the concepts and format of the Data that can be impo...
Problem While working with Charts in Android using the MPAndroidChart library, one inconsistency that I stumbled upon is the fact that all the Charts support...
Overview In the last post, I have previewed the workflow of the Charts components that I am working on for App Inventor. In this post, I will dive into some ...
Overview Following up on the Chart prototypes, this post will focus on previewing the current progress on the Charts components in App Inventor.
Overview In continuation to the previous previous blog post, this post will focus on a Line Chart Component prototype in App Inventor.
Overview During the initial steps of the project to develop Chart Components for App Inventor, the major focus was on the design of the components such that ...
As the community bonding period is nearing to an end and the coding period is about to begin, I would like give a status update on what happened in the last ...
Introduction I am Evaldas Latoškinas, currently a first year Computer Science & Engineering international student in the Netherlands at TU Delft. Origina...