App Inventor Chart Components: Project Summary
While working with Charts in Android using the MPAndroidChart library, one inconsistency that I stumbled upon is the fact that all the Charts support multiple data sets attached to them. All, except the Pie Chart, that is.
Surely, you may have encountered Pie Charts such as the following:
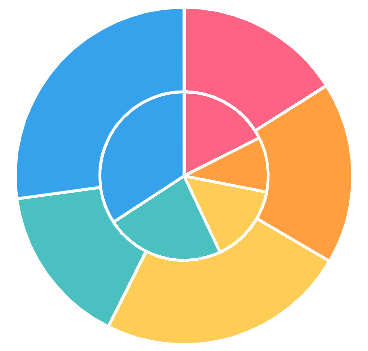
Clearly, the Pie Chart here represents two data sets – one for the inner ring, and one for the outer ring. In other words, the outer and the inner rings do not share the same data, generally.
Unfortunately, MPAndroidChart does not provide support for this directly. Adding more than one data set to the Pie Chart causes errors. If these errors are fixed (by means of creating a custom Legend), the data sets added after the first one simply have no effect. Thus, I have decided to look into an alternative solution while using this library. The general goal is to allow Pie Chart rings be added in a systematic way to generate Charts such as the one illustrated above.
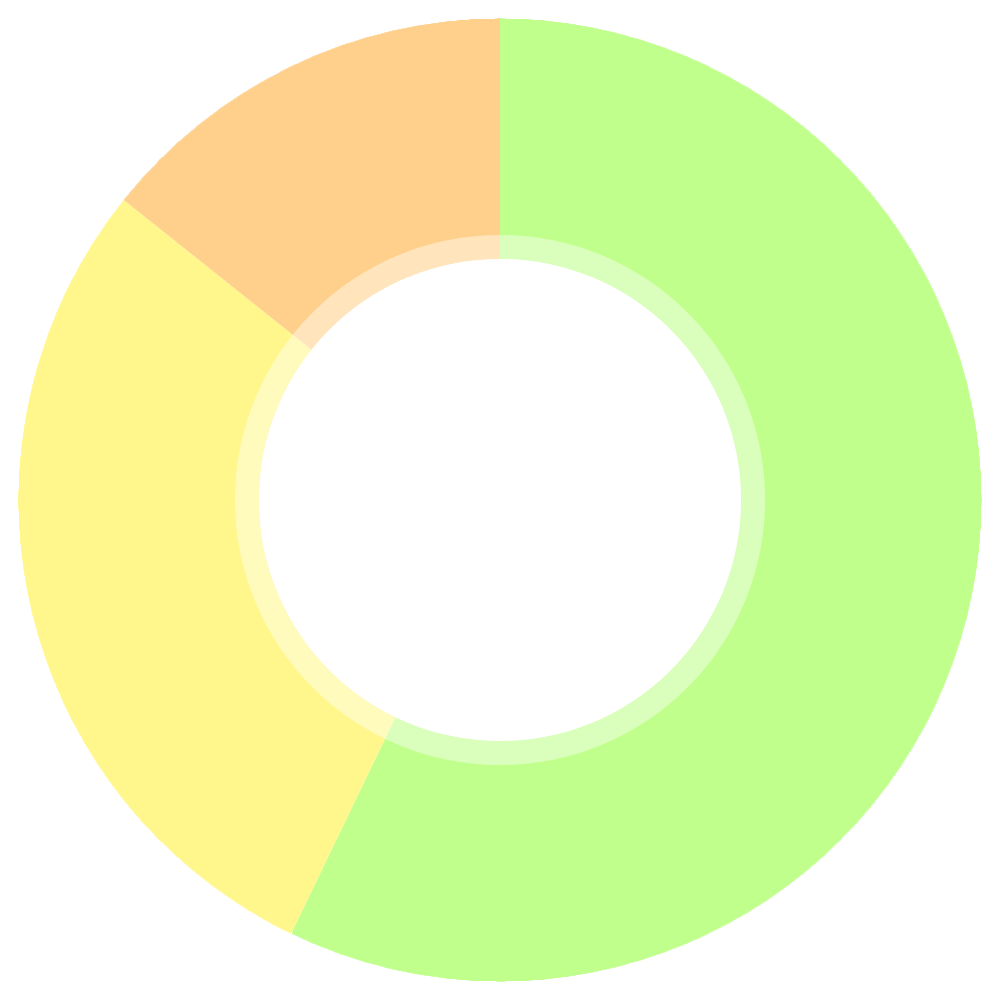
Typically, the Pie Charts in MPAndroidChart look as follows:
While looking for information on whether anyone has solved a similar problem before, I came across a useful StackOverflow post, which basically suggested a solution to create a two-level Pie Chart. The blog post, as well as examination of how Charting libraries in JavaScript handle concentric Pie Charts, I have been able to come up with some ideas on how to adapt this to solve the problem at hand.
The concept is simple – the inner-most Pie Chart ring is created as usual. To add an inner ring, a new Pie Chart is created, downscaled and drawn inside the outer Pie Chart. To create subsequent inner rings, they are downscaled and drawn inside the current inner-most ring, and so on.
Drawing inside the inner-most ring is quite straight forward. All the rings are simply centered inside one view, and as such they will be aligned as required. The challenge is finding a process of downscaling the Charts so that they fit together nicely. We will touch upon this after we define the process.
Generally, the process can be defined as follows:
It is important to note that generally the Pie Charts that we can fit inside another Pie Chart depend on the radius of the hole drawn inside the Pie Chart itself. For comparison, see these two Pie Charts:
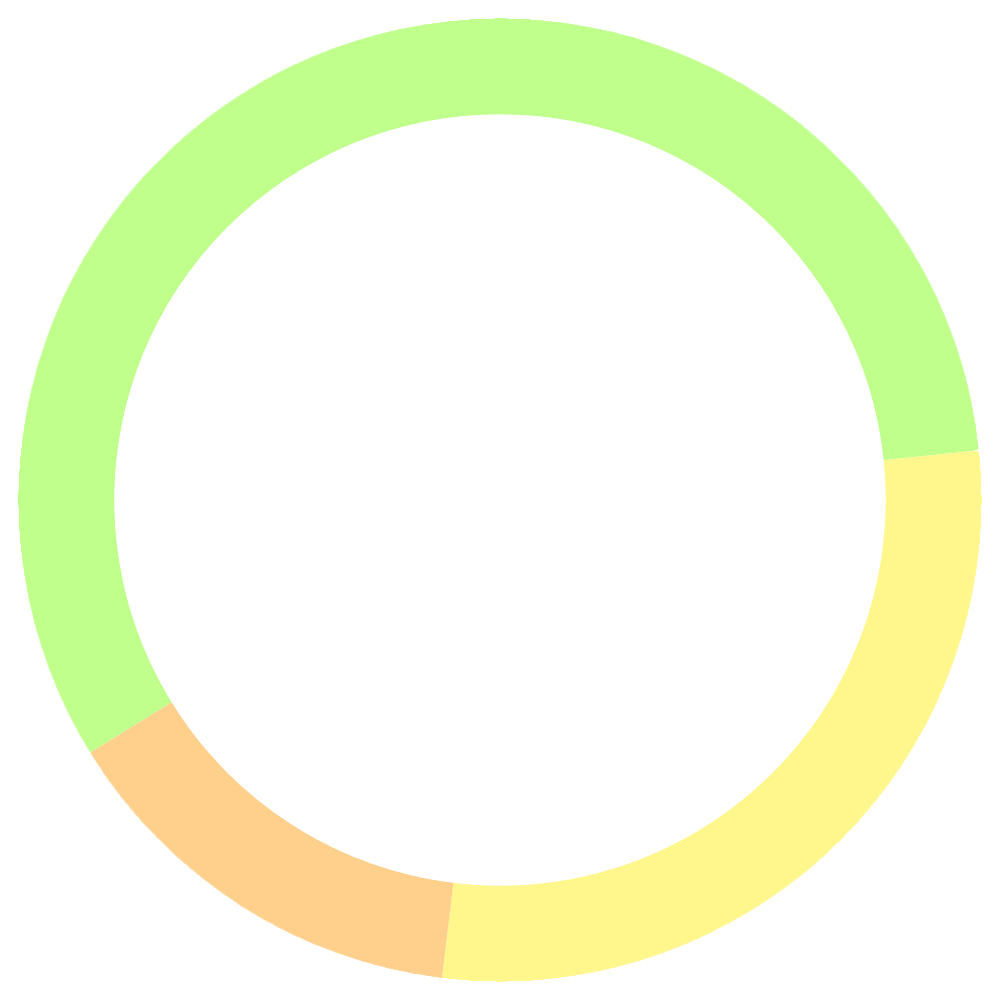
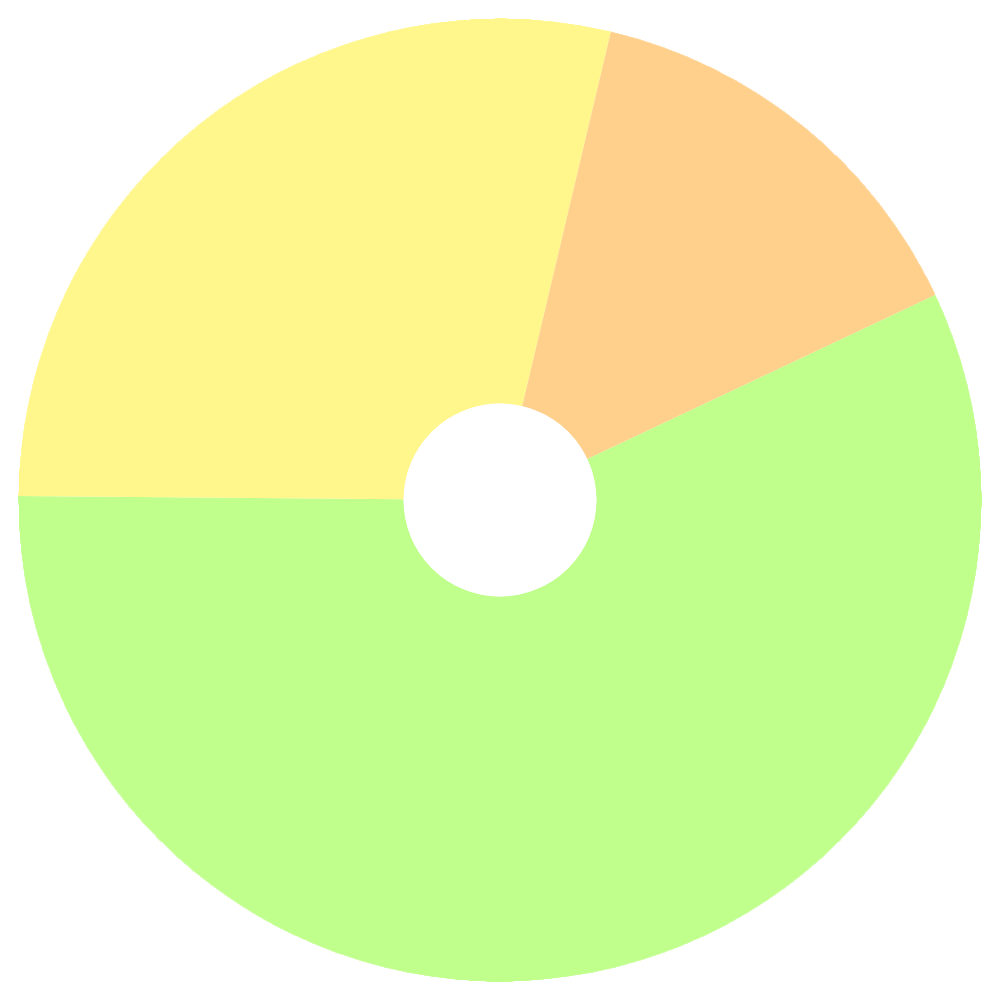
Clearly, the Pie Chart on the left would fit a bigger Pie Chart than the one on the right, simply because the radius of the inner hole is bigger.
Thus, it is import to scale the inner circle of a Pie Chart before adding a Pie Chart inside of it. For simplicity, in this post, I will keep it simple by using a fixed value, of, say, 75% hole radius. However, the value could be determined dynamically by the number of rings inside it.
To scale the Chart being added as the inner ring itself, it is generally sufficient to scale by the fraction of the hole radius, meaning, if we choose a radius of 75%, we would scale the width and the height of the inner ring by 0.75.
Now that we have covered the basic concept, let’s go to a basic implementation.
First, let’s define a generic method to create a Pie Chart with 3 entries and randomized colors:
    private PieChart createPieChart() {
        PieChart chart = new PieChart(this);

        // Create and populate PieDataSet
        PieDataSet pieDataSet = new PieDataSet(new ArrayList<PieEntry>(), "Data");
        pieDataSet.addEntry(new PieEntry(100f));
        pieDataSet.addEntry(new PieEntry(50f));
        pieDataSet.addEntry(new PieEntry(25f));

        // Set random colors for the 3 entries of the PieDataSet
        pieDataSet.setColors(getRandomColor(), getRandomColor(), getRandomColor());

        // Set Data Set to PieData; Set PieData to Chart
        PieData pieData = new PieData();
        pieData.setDataSet(pieDataSet);
        chart.setData(pieData);

        // Disable legend and description
        chart.getLegend().setEnabled(false);
        chart.getDescription().setEnabled(false);

        return chart;
    }
The code is fairly straightforward. One might wonder why I chose to disable the legend and the description. The reason is since we are drawing Pie Charts on top of each other, we do not want legends and descriptions for all of them, so we choose to disable them. The getRandomColor() is a method that I chose not to include here. Simply assume that it returns a random color.
Next, let’s look at creating the outermost Pie Chart:
    PieChart mainPieChart;
    List<PieChart> charts;

    private void initializeMainPieChart() {
        mainPieChart = createPieChart();

        // Set width and height of the Pie Chart to 1000
        mainPieChart.setLayoutParams(new PieChart.LayoutParams(1000, 1000));

        charts.add(mainPieChart);
    }
This is again fairly straight forward. We create a Pie Chart object instance with the previously defined method, set the width and height to 1000 (arbitrary number chosen here), and add the Pie Chart to the rings list (which we denote as Charts).
Now, on to the hardest part – the method that creates the Inner Pie Chart and adds it to a layout:
    RelativeLayout chartLayout;

    private void addInnerPieChart() {
        // Get the last chart in the charts list
        PieChart lastChart = charts.get(charts.size() - 1);

        // Re-scale hole radius of the last Chart to fit new Chart
        lastChart.setHoleRadius(75f);
        lastChart.setTransparentCircleRadius(75f);
        lastChart.invalidate();

        // Compute new width and height of the new Inner Chart
        int width = (int)(lastChart.getWidth() * 0.75f);
        int height = (int)(lastChart.getHeight() * 0.75f);

        // Create new inner Chart, add it to the Chart Layout
        PieChart innerChart = createPieChart();
        chartLayout.addView(innerChart);

        // Center & set the width and height parameters of the Inner Chart
        RelativeLayout.LayoutParams params = (RelativeLayout.LayoutParams)innerChart
                .getLayoutParams();
        params.addRule(RelativeLayout.CENTER_IN_PARENT, RelativeLayout.TRUE);
        params.width = width;
        params.height = height;
        innerChart.setLayoutParams(params);

        // Add Inner Chart to charts list
        charts.add(innerChart);
    }
First, we do the rescaling of the current inner-most Chart (the last Chart in the list) with the fixed hole radius of 75%. Then, we proceed to compute the new width and height for the new inner-most Chart.
Then, we create the inner Pie Chart, and add it to the Chart RelativeLayout (which, by the way, contains the mainPieChart initially). The reason we choose a RelativeLayout is to allow drawing views on top of each other.
Lastly, we configure the RelativeLayout parameters for the Chart itself. Note that we set the CENTER_IN_PARENT property to TRUE, which centers the Pie Charts in the RelativeLayout.
Lastly, we store the Inner Chart in the charts list.
Let us now bundle these methods together, and add a button to dynamically add rings to the Chart, to get the following activity initialization code:
    Button addPieChartButton;

    @Override
    protected void onCreate(Bundle savedInstanceState) {
        super.onCreate(savedInstanceState);
        setContentView(R.layout.activity_pie_charts);

        charts = new ArrayList<PieChart>();

        chartLayout = findViewById(R.id.pieChartLayout);

        initializeMainPieChart();
        chartLayout.addView(mainPieChart);

        addPieChartButton = findViewById(R.id.addInnerPieChartButton);

        addPieChartButton.setOnClickListener(new View.OnClickListener() {
            @Override
            public void onClick(View v) {
                addInnerPieChart();
            }
        });
}Here is a preview of the functionality that was covered in the post:
As such, the goals were accomplished, and concentric Pie Charts are indeed possible in MPAndroidChart. There are still improvements in this implementation, such as dynamic ring scaling, but the concept seems to work quite well in practice.
The full code (and some other MPAndroidChartExamples) is accessible in GitHub
Overview In the last post, I have thoroughly covered the implemented Pie Chart type for the App Inventor Chart components project that I have been working on...
Overview Last post, I have wrapped up the implemented methods for importing data to the Charts for the App Inventor Charts project that I have been working o...
Overview In the previous post on the App Inventor Chart Components project, I have covered data importing from Files, as well as from the Web. Previously, we...
Overview In the previous post on the App Inventor Chart Components project, we have looked at an extensive description of Chart Data Source concepts and real...
Overview It has been a while since the last post due to a highly busy period! A lot of blog posts were postponed, but now a series of posts will follow in th...
Overview Following up on the App Inventor Chart components project, this blog post will focus on a specific workflow aspect that allows to select the Chart t...
Overview With the workflow for the App Inventor Chart components established, the next step is to define the concepts and format of the Data that can be impo...
Problem While working with Charts in Android using the MPAndroidChart library, one inconsistency that I stumbled upon is the fact that all the Charts support...
Overview In the last post, I have previewed the workflow of the Charts components that I am working on for App Inventor. In this post, I will dive into some ...
Overview Following up on the Chart prototypes, this post will focus on previewing the current progress on the Charts components in App Inventor.
Overview In continuation to the previous previous blog post, this post will focus on a Line Chart Component prototype in App Inventor.
Overview During the initial steps of the project to develop Chart Components for App Inventor, the major focus was on the design of the components such that ...
As the community bonding period is nearing to an end and the coding period is about to begin, I would like give a status update on what happened in the last ...
Introduction I am Evaldas Latoškinas, currently a first year Computer Science & Engineering international student in the Netherlands at TU Delft. Origina...