App Inventor Chart Components: Project Summary
Following up on the Chart prototypes, this post will focus on previewing the current progress on the Charts components in App Inventor.
This post will focus on the Components from the User perspective, meaning that implementation details will not be covered in this post.
To complete the prototype and depict the idea of the Charts, the prototype was further extended to include Bar Charts and Pie Charts alongside Line Charts. Although the work for Bar and Pie Charts has been delayed to focus efforts and define the concepts on one type of Chart, they have been made to present to the developer team to give an idea of how they would look like.
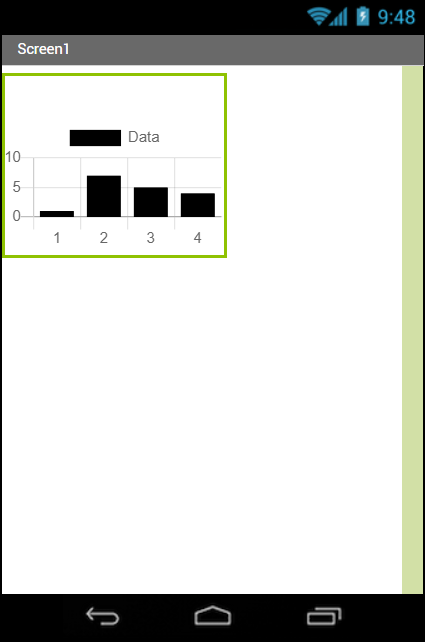
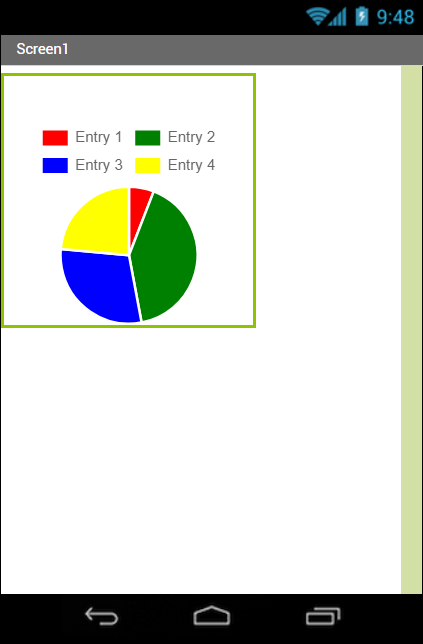

In the last post, two prototype versions were shown. In fact, however, the idea was redefined slightly from the two proposed models. Together with the developer team, we have made the final decision to use a 2-component model, where a Chart could be added, and then Data would be attached to the Chart separately. However, a further decision was to simply allow to drag & drop Data components on a Chart, providing ease of use and setup when working with Charts. The image summarizes the idea:
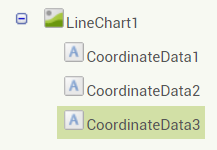
With the drag & drop workflow implementation, naturally, the next step was to implement multiple Data component support in the Charts themselves. Each Data component can be manipulated individually, and they would then be updated in the Chart separately.
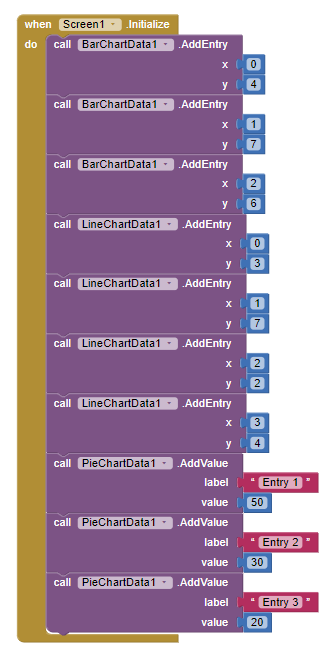
So if we add some entries into 3 attached Data components (following from the example of the previous section) using blocks, the Chart would look like this in the Android implementation:

Two properties have been implemented for the Data components so far – the color and the label. These properties have also been made responsive in the Designer interface to provide visual feedback to the user on how the Data would look like.
Since the Charts are different in Android than in the browser, they require a different implementation. In Android, if we apply some data properties to our Line Chart, currently it will look as follows:
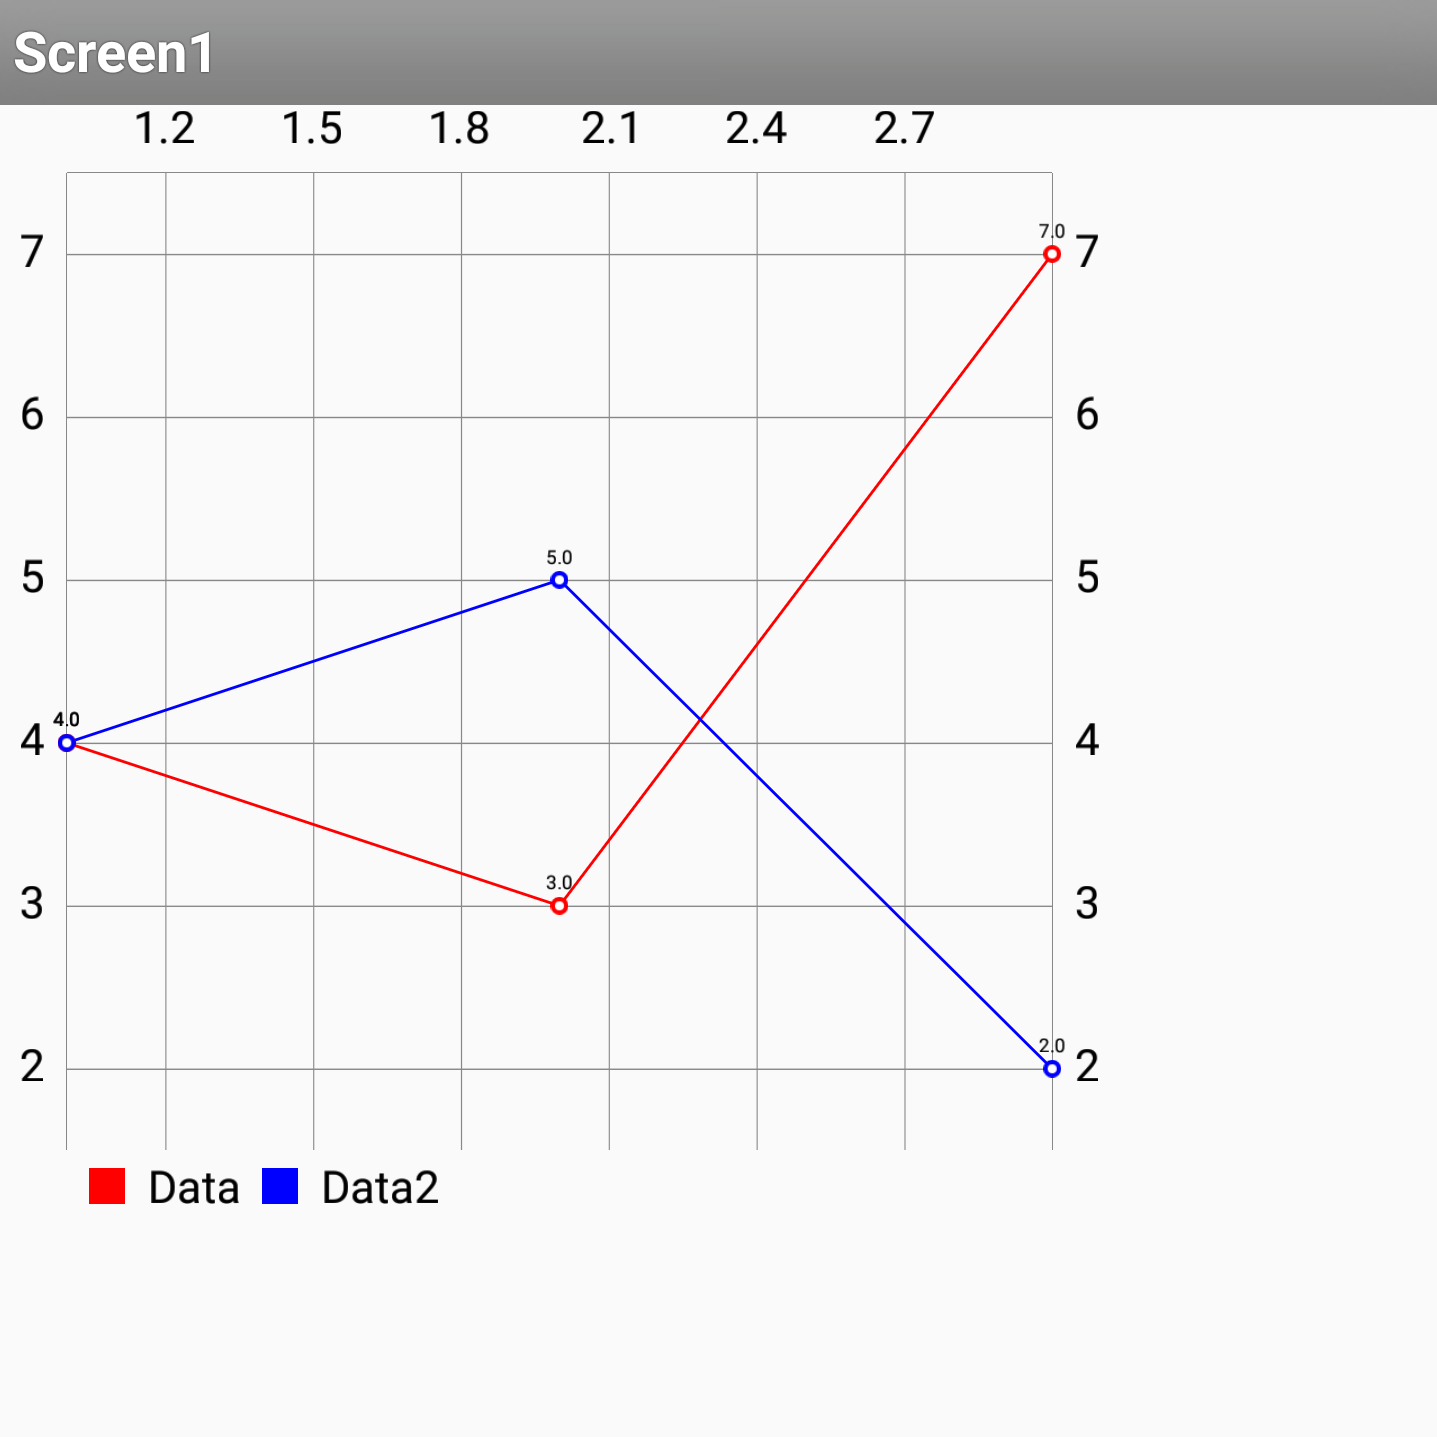
In the future, the Designer Chart components and the Android Chart components will be made to look more alike. But for now, the similarity is quite close.
Support has also been added to allow the User to quickly enter some data in a form field to add to the Chart. For now, this is quite basic, and only y-values can be specified, meaning that the first entered value will correspond to x value 1, the second to x value 2 and so on.
This has been a short preview of how the Chart components look and function so far to get a feeling of the general workflow of the Chart and Data components. A future blog post will follow describing some design choices and implementation details.
Overview In the last post, I have thoroughly covered the implemented Pie Chart type for the App Inventor Chart components project that I have been working on...
Overview Last post, I have wrapped up the implemented methods for importing data to the Charts for the App Inventor Charts project that I have been working o...
Overview In the previous post on the App Inventor Chart Components project, I have covered data importing from Files, as well as from the Web. Previously, we...
Overview In the previous post on the App Inventor Chart Components project, we have looked at an extensive description of Chart Data Source concepts and real...
Overview It has been a while since the last post due to a highly busy period! A lot of blog posts were postponed, but now a series of posts will follow in th...
Overview Following up on the App Inventor Chart components project, this blog post will focus on a specific workflow aspect that allows to select the Chart t...
Overview With the workflow for the App Inventor Chart components established, the next step is to define the concepts and format of the Data that can be impo...
Problem While working with Charts in Android using the MPAndroidChart library, one inconsistency that I stumbled upon is the fact that all the Charts support...
Overview In the last post, I have previewed the workflow of the Charts components that I am working on for App Inventor. In this post, I will dive into some ...
Overview Following up on the Chart prototypes, this post will focus on previewing the current progress on the Charts components in App Inventor.
Overview In continuation to the previous previous blog post, this post will focus on a Line Chart Component prototype in App Inventor.
Overview During the initial steps of the project to develop Chart Components for App Inventor, the major focus was on the design of the components such that ...
As the community bonding period is nearing to an end and the coding period is about to begin, I would like give a status update on what happened in the last ...
Introduction I am Evaldas Latoškinas, currently a first year Computer Science & Engineering international student in the Netherlands at TU Delft. Origina...