App Inventor Chart Components: Project Summary
With the workflow for the App Inventor Chart components established, the next step is to define the concepts and format of the Data that can be imported into the Chart. This post will cover both the design decisions made as well as the implementation of the Data importing.
The goals of the project are to support the following modes of data importing:
This post will focus on the first 3 methods of data importing (single entry, List and elements), and subsequent blog posts will follow up on other modes of data importing.
Before we dive into the details of the data formatting, let’s take a look at the simplest case - importing single entries.
For this, a simple block suffices, with arguments to specify the entry’s values, as follows:
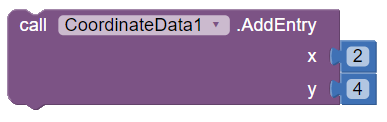
The notion of this block can then be extended to the multi-entry case, and it’s as simple as that.
As there are a lot of possible data sources where data may be imported from, some more generalized format of the data should be established.
One of the key challenges in the design of Data Importing is the fact that some Charts use pairs as entries, while others may use more dimensions. An example of this is the Bubble Chart, the entries of which have 3 values - the x, y values and the radius of the bubble. However, sources should have the ability to hold data for all types of Charts, even simultaneously, if needed.
Thus, it was decided to use tuples for the underlying values which would be fed into the Chart as the Data to be imported. A single Entry of a Chart would be considered a tuple, and the Data sources would then hold tuple data, which would be accepted by the Data components.
A pair (2-tuple):
(1, 2)A 3-tuple:
(1, 2, 3)The reason why tuples allow us to store data consistently is the fact that a single tuple can be represented as a List of objects. Since App Inventor’s implementations typically rely on what is coined the YailList (a List capable of holding objects of different types), we can make use of this and represent each entry as a YailList. Then, an entire Data Series can be represented as a List of tuples, which would be a YailList of YailLists in the underlying implementation.
As a matter of fact, it now does not matter how many elements the tuples have. We now have a consistent way of storing Chart compatible data in various data sources, by simply following this format.
To see our tuple definitions in realization, let’s take a look at the Import from List block, which accepts data in this format.
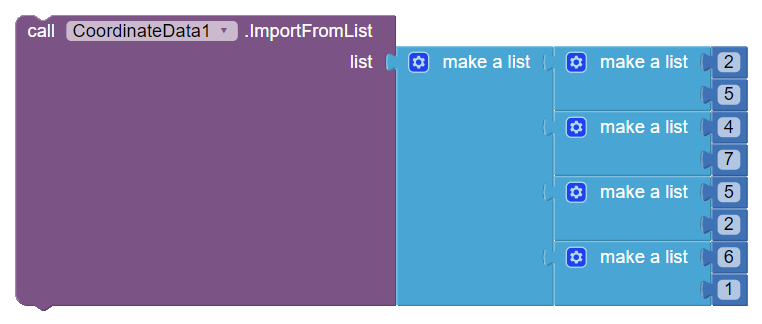
Here we see a List, which has nested sub-lists as its entries. Each nested sub-list represents a tuple, and can, in fact, be of arbitrary length.
An import from Lists operation in this case is essentially an importing of multiple tuples, one after the other. Thus, the most important part of the implementation here is the entry adding from a tuple itself.
From previous blog posts, we defined the concept of the ChartModel (now renamed to ChartDataModel), which handles data logic. Since every Chart type must handle tuples, we can, in fact, have one general abstract method for adding an entry from tuples, as follows:
public abstract class ChartDataModel<T extends DataSet, D extends ChartData> {

    /**
     * Adds an entry from a specified tuple.
     * @param tuple  Tuple representing the entry to add
     */
    public abstract void addEntryFromTuple(YailList tuple);
}
In the extension class, we then override the method to handle the logic on a case-by-case basis:
public class LineChartDataModel extends ChartDataModel<LineDataSet, LineData> {
    @Override
    public void addEntryFromTuple(YailList tuple) {
        try {
            String xValue = tuple.getString(0);
            String yValue = tuple.getString(1);

            try {
                float x = Float.parseFloat(xValue);
                float y = Float.parseFloat(yValue);

                addEntry(x, y);
            } catch (NumberFormatException e) {
                // Nothing happens: Do not add entry on NumberFormatException
            }
        } catch (Exception e) {
            // 2-tuples are invalid when null entries are present, or if
            // the number of entries is not sufficient to form a pair.
        }
    }

    /**
     * Adds a (x, y) entry to the Line Data Set.
     *
     * @param x  x value
     * @param y  y value
     */
    public void addEntry(float x, float y) {
        Entry entry = new Entry(x, y);
        dataset.addEntryOrdered(entry);
    }
}
Note here that there are a few pre conditions here. More precisely, the tuple must be of at least size 2, and the parameters of the tuple must be valid. In the future, it is planned to throw proper error messages when these conditions are not met.
The process itself is simple: the first two entries of the YailList are accessed, then they are parsed to floats, and then the appropriate entry is created and added to the Data Series.
While this mainly applies to the Line Chart case, the abstraction allows us to create some transparency, since classes invoking the method addEntryFromTuple method do not need to know about the underlying ChartModel instance.
Having defined possibly the most important method for data importing, importing from lists becomes very simple. It’s all a matter of getting tuples from the List, one by one, and then importing them via the defined method:
public abstract class ChartDataModel<T extends DataSet, D extends ChartData> {

    /**
     * Imports data from a YailList which contains nested tuples
     *
     * @param list  YailList containing tuples
     */
    public void importFromList(YailList list) {
        // Iterate over all the tuples
        for (int i = 0; i < list.size(); ++i) {
            YailList tuple = (YailList)list.getObject(i);
            addEntryFromTuple(tuple);
        }
    }
}For quick Charting solutions for example and tutorial purposes, it was also decided to provide the option to specify data via an Elements field in the Designer. Here is an example in the case of the CoordinateData component:
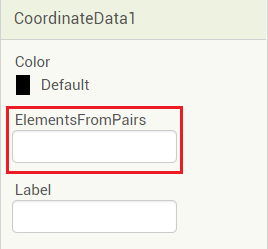
For now, the format of the values (for pair-based entry Charts) are as follows:
x1, y1, x2, y2, ...An example for Line Charts:s

For this mode of importing, we will again make use of tuples here.
public abstract class ChartDataModel<T extends DataSet, D extends ChartData> {
    /**
     * Sets the elements of the Data Series from a CSV-formatted String.
     *
     * @param elements String in CSV format
     */
    public void setElements(String elements) {
        // Get the expected number of tuples
        int tupleSize = getTupleSize();

        // Split all the CSV entries by comma
        String[] entries = elements.split(",");

        // Iterate over every tuple (by grouping entries)
        // We start from tupleSize - 1 since the (tupleSize - 1)-th
        // entry will be the last entry of the tuple.
        // The index is incremented by the tupleSize to move to the next
        // group of entries for a tuple.
        for (int i = tupleSize - 1; i < entries.length; i += tupleSize) {
            List<String> tupleEntries = new ArrayList<String>();

            // Iterate over all the tuple entries
            // First entry is in (i - tupleSize + 1)
            for (int j = tupleSize - 1; j >= 0; --j) {
                int index = i - j;
                tupleEntries.add(entries[index]);
            }

            // Add entry from the parsed tuple
            addEntryFromTuple(YailList.makeList(tupleEntries));
        }
    }
}
The notion of tuples here comes in handy, since this code applies for all Chart types, whether they use 2-tuples, 3-tuples or even more dimensions.
The process is as follows:
The importing from elements in the Mock components works a bit differently. The key difference is that there is a requirement to fall back to the default elements option to provide visual information on the attached Data components.
The code for the Line Chart case is as follows:
public class MockLineChartDataModel extends MockChartDataModel<ScatterDataset> {
    @Override
    public void setElements(String elements) {
        String[] entries = elements.split(",");

        // Create new list of Data Points
        ArrayList<DataPoint> dataPoints = new ArrayList<DataPoint>();

        // Since entries come in pairs, we add 2 on each iteration.
        // Beginning from i = 1 instead of 0 to prevent out of bounds
        // accesses.
        for (int i = 1; i < entries.length; i += 2) {
            try {
                DataPoint dataPoint = new DataPoint();
                dataPoint.setX(Double.parseDouble(entries[i-1]));
                dataPoint.setY(Double.parseDouble(entries[i]));
                dataPoints.add(dataPoint);
            } catch (NumberFormatException e) {
                return; // Wrong input. Do not update entries.
            }
        }

        // No data points generated, fallback to default option.
        if (dataPoints.isEmpty()) {
            setDefaultElements(dataPoints);
        } else {
            // Since we are dealing with a Scatter Data Series, sorting
            // is a must, because otherwise, the Chart will not look representative.
            // Consider adding: (1, 2), (5, 3), (2, 5). We want the x = 2
            // value to be continuous on the Line Chart, rather than
            // going outside the Chart, which would happen since we
            // are using a Scatter Chart.
            dataPoints.sort(Comparator.comparingDouble(DataPoint::getX));
        }

        // Set the generated data points to the Data Series
        dataSeries.setDataPoints(dataPoints);
    }

    @Override
    protected void setDefaultElements(List<DataPoint> dataPoints) {
        final int points = 4; // Number of points to add

        // TBD: Might change this in the future.
        // Generally, this should not cause performance issues because typically there are not
        // that many data points.
        Optional<DataPoint> maxYPoint = chartData.getDatasets() // Get all the data sets
                .stream() // Create a stream
                .flatMap(l -> ((ScatterDataset)l).getDataPoints().stream()) // Flatten the nested lists to a List of data points
                .max(Comparator.comparing(DataPoint::getY)); // Get the maximum data point value

        // Get the maximum data point Y value. We take the maximum to ensure
        // that our newly added default data does not overlap existing lines.
        double yVal = maxYPoint.map(DataPoint::getY).orElse(0.0);

        for (int i = 0; i < points; ++i) {
            DataPoint dataPoint = new DataPoint();
            dataPoint.setX(i+1);
            dataPoint.setY((yVal + i));
            dataPoints.add(dataPoint);
        }
    }
}
The main difference (apart from the default elements setting) is the sorting of the Data points, which is due to the library’s representation of the Scatter Chart. Since Line Charts have to be continuous, but there is also a requirement to add data points dynamically, as well as have automatic x and y scaling, it was decided to use a Scatter Chart instead of a Line Chart, with the option to show lines between points enabled.
As for the default elements, one issue that can arise when adding Data components is that lines start overlapping each other. To prevent this, the next Line is added above all the data (so the lowest point of the Line starts at the current maximum value of the Chart’s data points).
For now, the implementation is quite cumbersome, and will most likely change in the future. But for the core functionality, it suffices.
This has been the core functionality of data importing. More updates will follow on the status of the project and further implementations and design choices of other data source importing options. Stay tuned!
Overview In the last post, I have thoroughly covered the implemented Pie Chart type for the App Inventor Chart components project that I have been working on...
Overview Last post, I have wrapped up the implemented methods for importing data to the Charts for the App Inventor Charts project that I have been working o...
Overview In the previous post on the App Inventor Chart Components project, I have covered data importing from Files, as well as from the Web. Previously, we...
Overview In the previous post on the App Inventor Chart Components project, we have looked at an extensive description of Chart Data Source concepts and real...
Overview It has been a while since the last post due to a highly busy period! A lot of blog posts were postponed, but now a series of posts will follow in th...
Overview Following up on the App Inventor Chart components project, this blog post will focus on a specific workflow aspect that allows to select the Chart t...
Overview With the workflow for the App Inventor Chart components established, the next step is to define the concepts and format of the Data that can be impo...
Problem While working with Charts in Android using the MPAndroidChart library, one inconsistency that I stumbled upon is the fact that all the Charts support...
Overview In the last post, I have previewed the workflow of the Charts components that I am working on for App Inventor. In this post, I will dive into some ...
Overview Following up on the Chart prototypes, this post will focus on previewing the current progress on the Charts components in App Inventor.
Overview In continuation to the previous previous blog post, this post will focus on a Line Chart Component prototype in App Inventor.
Overview During the initial steps of the project to develop Chart Components for App Inventor, the major focus was on the design of the components such that ...
As the community bonding period is nearing to an end and the coding period is about to begin, I would like give a status update on what happened in the last ...
Introduction I am Evaldas Latoškinas, currently a first year Computer Science & Engineering international student in the Netherlands at TU Delft. Origina...