App Inventor Chart Components: Project Summary
In continuation to the previous previous blog post, this post will focus on a Line Chart Component prototype in App Inventor.
The goal of prototyping in this case is to first determine whether the chosen approach is the right way to go, or whether revisions are needed to the concepts and design itself. For this reason, a few prototypes have been devised. From the previous post, two different general models for the components were presented – one where the Chart component holds both the view & the data, and the other where the view & the data are divided into two components, one being the Chart component, and the other being the Data component. The prototypes focus on these two models.
Since the aim is to develop some simple prototypes, the Chart is not really intricate with features. A few features have been added for example purposes. The following criteria are satisfied in the prototypes:
With these features in mind, let’s first look at the differences between the two prototypes.
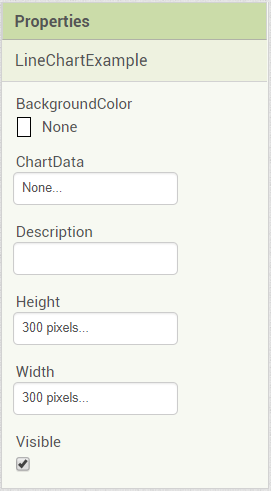
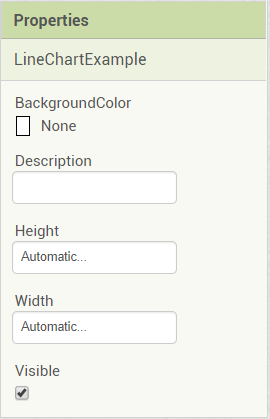
The left images correspond to the 2 Component model, and the right images correspond to the 1 Component model.


With these differences in mind, the implementation itself does not differ that greatly. Since the 2 component model is a bit more intricate, this post will focus on this model’s implementation. The entire implementation will not be covered, and only some important key aspects will be detailed here. For the interested readers, see the pull request in my repository for the full changes.
The Android library used for the Charts is MPAndroidChart.
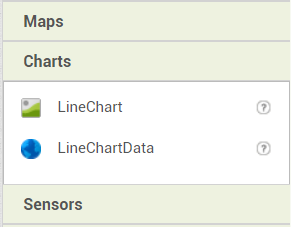
Since this model aims at separating the data from the view, the view is the component that is visible, and the data is non-visible in the GUI.
It is a standard in App Inventor’s component class hierarchy to provide AndroidVisibleComponent and AndroidNonVisibleComponent classes. Thus, the Chart should be an extension from the AndroidVisibleComponent class, and the Data should be an extension form the AndroidNonVisibleComponent class.
Now, let’s take a look at the abstract classes for the Chart and the Data components.
public abstract class ChartDataBase<T extends ChartData> extends AndroidNonvisibleComponent {

    protected T chartData;
public abstract class ChartBase<T extends Chart, D extends ChartDataBase> extends AndroidViewComponent {
protected T view;
protected D data;Note that the object types Chart and ChartData are classes of MPAndroidChart. The ChartDataBase in ChartBase is the ChartDataBase that we define, however!
The idea is to make use of generics to allow us to treat the objects in Chart implementations as the actual needed objects. For instance, take a look at the signature of the LineChart component class:
public final class LineChart extends ChartBase<com.github.mikephil.charting.charts.LineChart, LineChartData>The ‘T’ becomes the LineChart class of the MPAndroidChart, and the ‘D’ becomes the LineChartData component that is an extension of ChartDataBase.
With this structure, we have a convenient way of representing the hierarchy in the implementation.
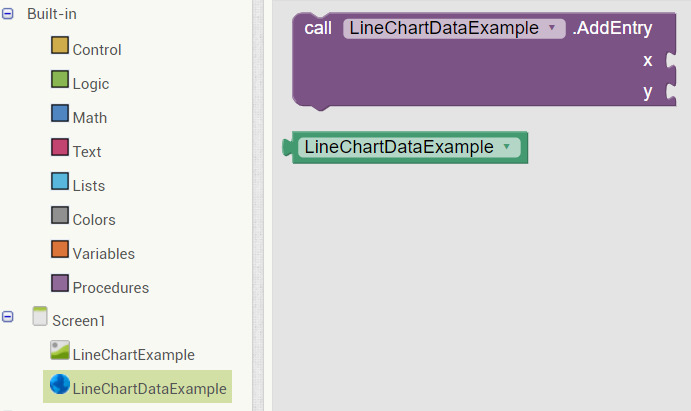
Let us now move on to adding the entries. In this model, all the data operations should be moved to the Data components. For now, the decision was to store all the logic in LineChartData, and do proper abstractions later on, when more design decisions have been accepted (especially on the other data set types).
In LineChartData, the following method has been added:
    /**
     * Adds entry to the Line Data Series
     *
     * @param x - x value of entry
     * @param y - y value of entry
     */
    @SimpleFunction(description = "Adds (x, y) point to the Line Data.")
    public void AddEntry(int x, int y) {
        Entry entry = new Entry(x, y);

        if (chartData.getDataSetCount() == 0) {
            LineDataSet dataSet = new LineDataSet(new ArrayList<Entry>(), "Data");
            dataSet.setColor(Color.BLACK);
            dataSet.setCircleColor(Color.BLACK);
            dataSet.addEntry(entry);
            chartData.addDataSet(dataSet);
        } else {
            chartData.getDataSetByIndex(0).addEntryOrdered(entry);
            chartData.notifyDataChanged();
        }

        refreshCharts();
    }
Since this is a prototype, right now the aim is to have at most one data set (hence the if statement in the code).
Initially, an entry using the x and y values is constructed. Then, an if statement is done to check if an entry already exists (if it does not, then there is no data set). If the entry does not exist, a new data set is created, the first entry is added, and that dataset is added to the chartData object instance.
If a dataset already exists, the entry is simply added to the chartData. Note the addEntryOrdered call here. If we do not use entry ordered, then adding lower x values will result in the Line Chart going backwards, which is not what we want. This method version guarantees that the entries will be sorted after insertion, and thus the Line Chart is not broken. Then we notify that the chart data has been changed to refresh the Chart.
The final line refreshes the Charts, and we will take a look at this in a few sections.
Charts are linked with the ChartData by having a ChartData property. ChartData objects can then be attached to Charts.
Due to ChartData concrete types depending on the Chart type, the method to set the property has to be written in the implemented classes due to issues with dynamic types when compiling the code.
As such, we have the following method to add a LineChartData component to a LineChart:
    @SimpleProperty(category = PropertyCategory.BEHAVIOR,
            description = "")
    @DesignerProperty(editorType = PropertyTypeConstants.PROPERTY_TYPE_COMPONENT + ":com.google.appinventor.components.runtime.LineChartData")
    public void ChartData(LineChartData data) {
        // Remove this Chart from previous LineChartData component
        if (data != null) {
            data.removeChart(this);
        }

        // Add Chart to LineChartData component
        data.addChart(this);

        this.data = data;
        view.setData(this.data.getChartData());
        view.invalidate();
    }
The removeChart and addChart methods will be covered in the next section.
What interests us here is the setData and invalidate methods. setData sets the ChartData object (which is part of MPAndroidChart) to the Chart, thus effectively loading the data, and invalidate refreshes the Chart to display the newly added data.
One problem that arises when using the library and implementing this model is the need to refresh the Chart after adding the data. However, in order to do so, access to the actual Chart view is needed, but the Data Set is decoupled from the Chart.
The approach is then to create Chart component references from the Data component in order to refresh the Charts.
The following method was written in ChartBase:
    /**
     * Refreshes the Chart to react to Data Set changes.
     */
    public void Refresh() {
        view.notifyDataSetChanged();
        view.invalidate();
    }
The method is made public so the Data Set component can call it. Now let’s look at the relevant code in ChartDataBase:
    protected HashSet<ChartBase> charts;

    /**
     * Add Chart component to observe by this Chart Data component.
     *
     * @param chart  Chart component
     */
    public void addChart(ChartBase chart) {
        charts.add(chart);
    }

    /**
     * Refreshes all the Charts that use this Chart Data component.
     * Called whenever there are changes to the underlying Chart data object.
     */
    protected void refreshCharts() {
        for (ChartBase chart : charts) {
            if (chart != null) {
                chart.Refresh();
            }
        }
The implementation is rather simple. We simply keep a HashSet containing ChartBase classes. There is a method to add a new Chart to be observed by the Data component, and there is a method to refresh all the observed Charts, so that their data is updated in the view.
A removeChart method was also later added to remove Charts that no longer use the data set:
    /**
     * Removes a Chart Component to be observed by this Chart Data component
     *
     * @param chart  Chart component
     */
    public void removeChart(ChartBase chart) {
        charts.remove(chart);
}The final step of the simple prototype version is to implement a responsive UI component.
Charba was chosen as the library for the implementation of the component, which is a GWT wrapper library of the well-known Chart.js charting library.
The component is still in an early stage, and is mainly intended for presentation purposes, so details of the implementation will not be covered here. For the curious readers, the code changes are available on a pull request.
The basic idea is to initialize the Line Chart component from the library, add placeholder data, style it to look similar to the MPAndroidChart representation (although styling was not given priority right now, more can be done on that part) and add functionality to respond to changes.
The end result is summarized in this gif:

Stay tuned for more!
Overview In the last post, I have thoroughly covered the implemented Pie Chart type for the App Inventor Chart components project that I have been working on...
Overview Last post, I have wrapped up the implemented methods for importing data to the Charts for the App Inventor Charts project that I have been working o...
Overview In the previous post on the App Inventor Chart Components project, I have covered data importing from Files, as well as from the Web. Previously, we...
Overview In the previous post on the App Inventor Chart Components project, we have looked at an extensive description of Chart Data Source concepts and real...
Overview It has been a while since the last post due to a highly busy period! A lot of blog posts were postponed, but now a series of posts will follow in th...
Overview Following up on the App Inventor Chart components project, this blog post will focus on a specific workflow aspect that allows to select the Chart t...
Overview With the workflow for the App Inventor Chart components established, the next step is to define the concepts and format of the Data that can be impo...
Problem While working with Charts in Android using the MPAndroidChart library, one inconsistency that I stumbled upon is the fact that all the Charts support...
Overview In the last post, I have previewed the workflow of the Charts components that I am working on for App Inventor. In this post, I will dive into some ...
Overview Following up on the Chart prototypes, this post will focus on previewing the current progress on the Charts components in App Inventor.
Overview In continuation to the previous previous blog post, this post will focus on a Line Chart Component prototype in App Inventor.
Overview During the initial steps of the project to develop Chart Components for App Inventor, the major focus was on the design of the components such that ...
As the community bonding period is nearing to an end and the coding period is about to begin, I would like give a status update on what happened in the last ...
Introduction I am Evaldas Latoškinas, currently a first year Computer Science & Engineering international student in the Netherlands at TU Delft. Origina...