App Inventor Chart Components: Project Summary
Following up on the App Inventor Chart components project, this blog post will focus on a specific workflow aspect that allows to select the Chart type dynamically.
A design decision was accepted to allow to select the Chart type on the fly, rather than having to use a different component for a different Chart type each time. This effectively means that there is a single Chart component in the entire application, but the component itself holds all the possible Chart type options.
While the major focus is implementing a Chart type selection system, in fact the toughest part was adapting and finalizing the final component design that would be fit for this task. Following up on one of the previous posts, I have decided to make an extension that would be more adaptable to this specific case.
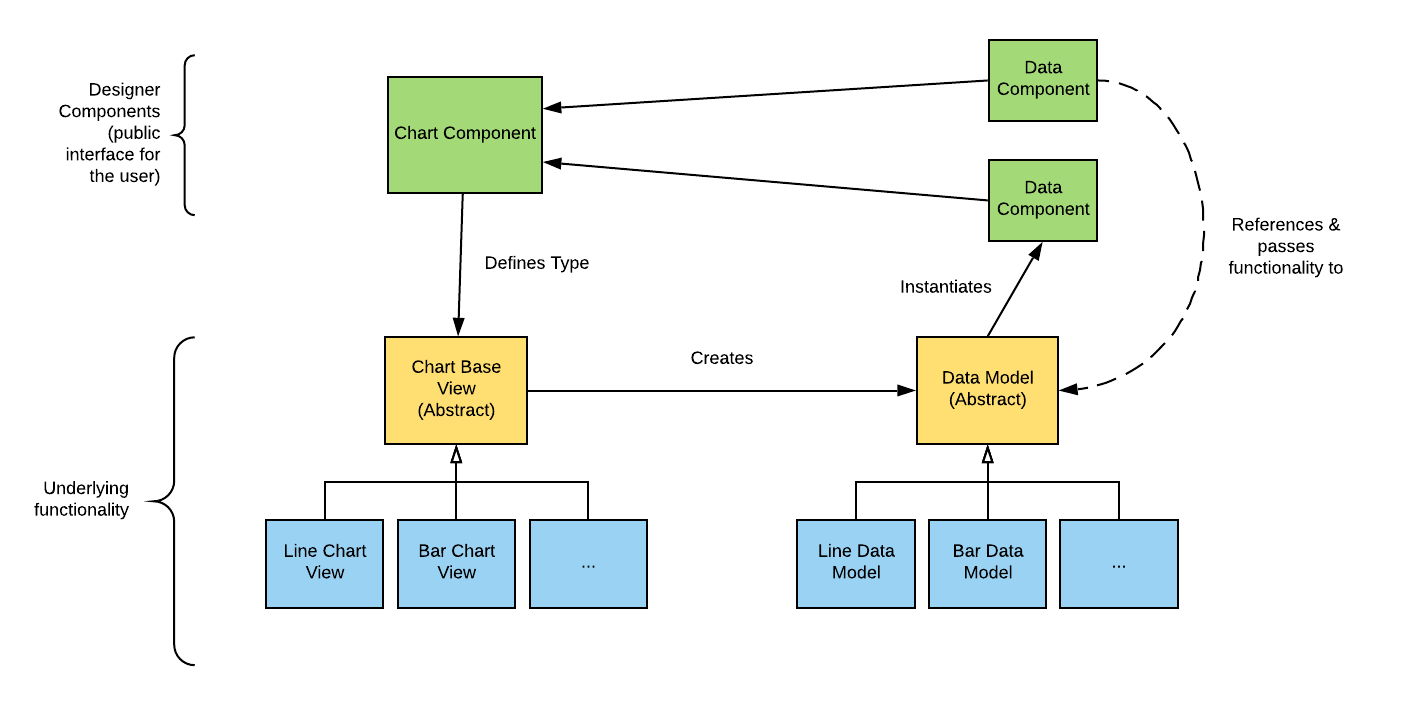
The designer component layer is the public interface visible to the user. This comprises of the Chart component (with the type property to select a Chart), and the attachable Data components. This has not changed much from the previous design, apart from these components now being considered part of one coherent layer.
The bottom part is the functionality layer. The bulk of the GUI and data logic lives here, and this is not visible to the user, but rather an internal part of the components.
The Chart component directly defines the Chart View type, since the type property is selected via the component itself. The View objects are made with the intention to form a hierarchy, and ultimately, a subclass should exist for each possible Chart type (Line, Bar, Pie, etc.)
Logic wise, the view is responsible for initializing the appropriate Chart view, as well as pass on any Chart-related logic (which mostly comprises of Chart GUI functions) from the Chart component.
Finally, the Data Model is instantiated by the View, since the type of the Data model required is defined by the type of the Chart (e.g. Pie Charts have different data types than Line Charts)
This is the most important addition of the design (iterated form the previous design), since it allows to abstract the Chart component away from the underlying view, effectively separating the concerns of the library implementation and App Inventor’s needs. This also allows to be flexible when introducing new Chart types.
In terms of the Data Model, it pretty much remains the same as in the previously discussed design (in the post mentioned at the beginning of the Component Design section). The Data Model handles all the data logic, and most functionality is passed to this Data Model from the Data components.
With the Chart component design finalized, the next step was to introduce the Type property, which looks as follows:
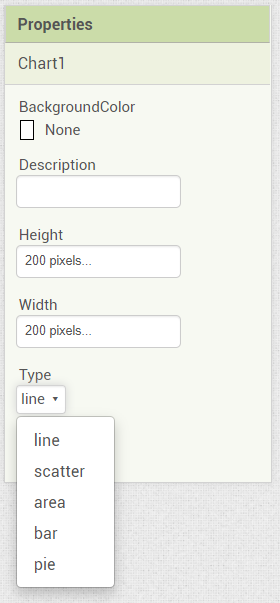
The underlying workflow of the Type property is a bit more complex than it might appear at first. What actually happens is the following:
To the user, it looks as follows:
The snippets of the code for the Designer Chart component in terms of the type property change is as follows:
    /**
     * Sets the type of the Chart to the newly specified value.
     * @param value  new Chart type
     */
    private void setTypeProperty(String value) {
        // Update type
        type = Integer.parseInt(value);

        // Keep track whether this is the first time that
        // the Chart view is being initialized
        boolean chartViewExists = (chartView != null);

        // Remove the current Chart Widget from the root panel (if present)
        if (chartViewExists) {
            rootPanel.remove(chartView.getChartWidget());
        }

        // Create a new Chart view based on the supplied type
        chartView = createMockChartViewFromType(type);

        // Add the Chart Widget to the Root Panel (as the first widget)
        rootPanel.insert(chartView.getChartWidget(), 0);

        // Chart view already existed before, so the new Chart view must
        // be reinitialized.
        if (chartViewExists) {
            reinitializeChart();
        }
    }

    /**
     * Creates and returns a new MockChartView object based on the type
     * (integer) provided
     * @param type  Chart type (integer representation)
     * @return new MockChartView object instance
     */
    private MockChartView createMockChartViewFromType(int type) {
        switch(type) {
            case ComponentConstants.CHART_TYPE_LINE:
                return new MockLineChartView();
            case ComponentConstants.CHART_TYPE_SCATTER:
                return new MockScatterChartView();
            case ComponentConstants.CHART_TYPE_AREA:
                return new MockAreaChartView();
            // ...
            default:
                // Invalid argument
                throw new IllegalArgumentException("type:" + type);
        }
    }
The setTypeProperty method is invoked when the property is changed. Since all properties are passed in as Strings, the value is parsed, the old Chart view is removed (if it exists), the new one is created and added, and the Chart is reinitialized.
With the help of the Chart View abstraction, this became a far more simple task than it would be otherwise, since we do not have to worry about handling the View itself!
Before the Type property initialization, I had decided to work only on the Line Chart to focus the concepts on one single Chart type to not overcomplicate matters.
However, with the component design finalized, I figured it would be a good idea to invest into implementing more Chart types, which would also allow generalizing the code a bit more to support other Chart types.
Since Area and Scatter Charts are very close to Line Charts (they share the same data type), I decided to first go for these two Chart types.
To incorporate Area and Scatter Charts, I came up with the following hierarchy (orange & dashed boxes represent abstract classes):

A few observations:
Recall that the Chart Data component would get a Chart Data Model reference as follows:
    // Creates a ChartDataModel based on the current
    // Chart type being used.
    chartDataModel = chart.createChartModel();
To extend on the previous point of the Chart Model creation being handled by the views, here are a few examples of how the Model is created in the Views themselves:
public class ScatterChartView extends PointChartView<ScatterChart, ScatterData> {

  // ...

  @Override
  public ChartDataModel createChartModel() {
    return new ScatterChartDataModel(data);
  }
}

public class LineChartView extends LineChartViewBase {
    // ...

    @Override
    public ChartDataModel createChartModel() {
        return new LineChartDataModel(data);
    }
}
By defining the View and Model classes together, the library functionality is essentially abstracted away from the user-controlled components themselves, making the code more modular, extendible and separated.
Here is a preview of the Charts in both Android and the Designer (recall that different libraries are used, and some alterations have been made to make them look similar):

For the curiuos readers, the main pull requests related to these features can be found here:
It has been a while since the creation of this post. I have been keeping quite busy with the project, but do expect updates on the project soon! The next post will most likely follow up on the Data importing methods, since that has been the focus of the last few weeks. Stay tuned!
Overview In the last post, I have thoroughly covered the implemented Pie Chart type for the App Inventor Chart components project that I have been working on...
Overview Last post, I have wrapped up the implemented methods for importing data to the Charts for the App Inventor Charts project that I have been working o...
Overview In the previous post on the App Inventor Chart Components project, I have covered data importing from Files, as well as from the Web. Previously, we...
Overview In the previous post on the App Inventor Chart Components project, we have looked at an extensive description of Chart Data Source concepts and real...
Overview It has been a while since the last post due to a highly busy period! A lot of blog posts were postponed, but now a series of posts will follow in th...
Overview Following up on the App Inventor Chart components project, this blog post will focus on a specific workflow aspect that allows to select the Chart t...
Overview With the workflow for the App Inventor Chart components established, the next step is to define the concepts and format of the Data that can be impo...
Problem While working with Charts in Android using the MPAndroidChart library, one inconsistency that I stumbled upon is the fact that all the Charts support...
Overview In the last post, I have previewed the workflow of the Charts components that I am working on for App Inventor. In this post, I will dive into some ...
Overview Following up on the Chart prototypes, this post will focus on previewing the current progress on the Charts components in App Inventor.
Overview In continuation to the previous previous blog post, this post will focus on a Line Chart Component prototype in App Inventor.
Overview During the initial steps of the project to develop Chart Components for App Inventor, the major focus was on the design of the components such that ...
As the community bonding period is nearing to an end and the coding period is about to begin, I would like give a status update on what happened in the last ...
Introduction I am Evaldas Latoškinas, currently a first year Computer Science & Engineering international student in the Netherlands at TU Delft. Origina...